
How to Combine Indicators Without Overload
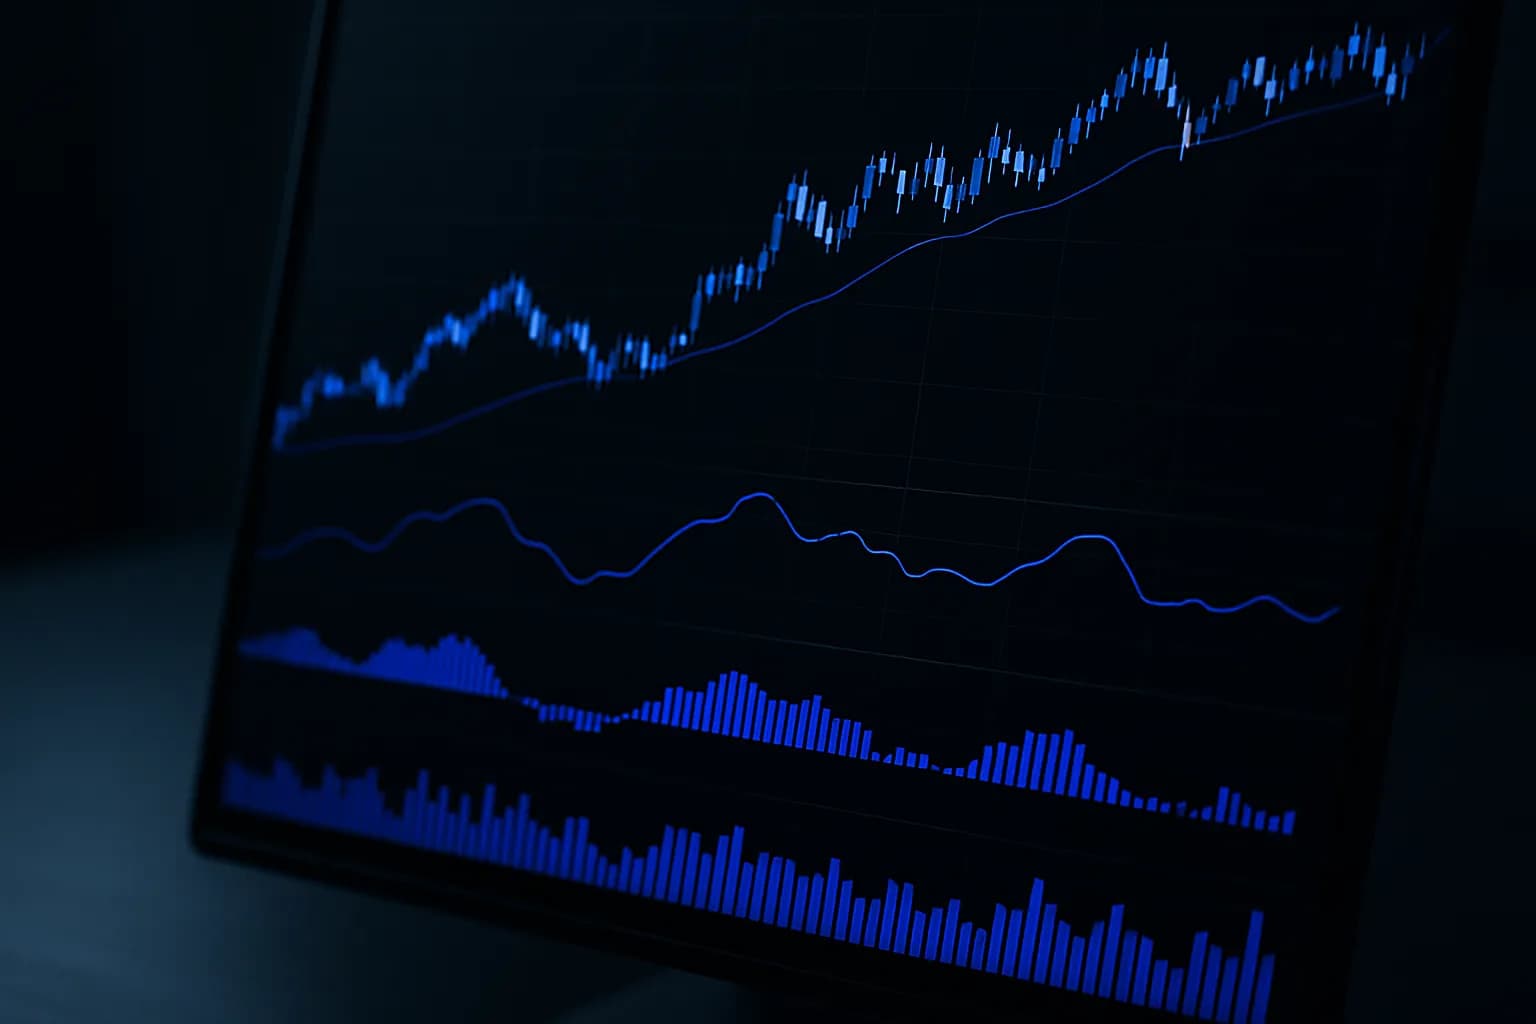
The key to combining indicators effectively is to mix tools from different categories so each adds new information: a trend tool, a momentum tool, and a volume tool. Stacking several indicators from the same category, like three momentum oscillators, creates redundant, conflicting signals rather than genuine confirmation.
Key takeaway
Why does combining indicators matter?
Combining indicators well is one of the most important skills in technical analysis, because no single indicator captures everything about price. A trend tool tells you direction but not strength; a momentum tool tells you strength but not participation. Used together, complementary tools build a fuller picture than any one alone.
The challenge is doing it without overloading the chart. Many traders make the mistake of adding more and more technical indicators in search of certainty, only to end up with a tangle of conflicting signals. The goal is not maximum coverage but balanced coverage: a small set of tools, each addressing a different dimension of price action, so they confirm rather than repeat one another. This same principle drives our guide to the best indicators for day trading.
What are the main indicator categories?
Indicators fall into a few broad categories, each measuring a different aspect of price. Effective combinations draw one tool from each relevant category rather than several from one.
| Category | Measures | Examples |
|---|---|---|
| Trend | Direction and persistence | Moving averages, VWAP, ADX |
| Momentum | Speed and strength | RSI, MACD, ROC, stochastic |
| Volume | Participation | OBV, volume, money flow |
| Volatility | Range and stretch | Bollinger Bands, ATR, Keltner |
Trend tools like moving averages show which way the market is heading. Momentum tools like the RSI and MACD show how forceful the move is. Volume tools confirm whether participation backs the move. Volatility tools like Bollinger Bands show how stretched or calm price is. Mixing across these categories gives each indicator a distinct job, which is what turns a combination into confirmation.
What is indicator redundancy?
Indicator redundancy is the trap of using multiple tools that measure the same thing. The most common version is stacking several momentum oscillators, such as the RSI, the stochastic, and the Williams %R, all on the same chart.
The problem is that these are built on similar math and respond to the same price behavior, so they mostly produce the same signal. When all three flash oversold at once, it feels like strong confirmation, but it is really one signal repeated three times. This creates a false sense of confidence and clutters the chart without adding information. Redundancy is the single most common mistake in combining indicators, and avoiding it is as important as choosing good tools. If two indicators almost always agree, you only need one of them.
What are good indicator combinations?
A good combination covers different dimensions with one tool each. The classic, non-redundant setup pairs trend, momentum, and volume.
- Trend plus momentum plus volume. A moving average or VWAP for trend, the RSI or MACD for momentum, and volume for participation. Trade with the trend, when momentum agrees, on moves backed by volume.
- Trend plus volatility. A moving average for direction and Bollinger Bands for stretch, useful for spotting pullbacks and squeezes within a trend.
- Trend strength plus entry. The ADX to confirm a trend exists, plus a momentum or crossover tool for timing, filtering out range-bound chop.
In each case, the tools answer different questions and confirm one another only when they genuinely agree from different angles. That kind of agreement, across categories, is meaningful confirmation, unlike the hollow agreement of redundant oscillators. Pick one combination, learn it deeply, and resist the urge to bolt on extras.
Why is using too many indicators a problem?
Beyond redundancy, simply using too many indicators causes practical problems. A cluttered chart produces conflicting signals, slows down decisions, and breeds the overconfidence that comes when several tools happen to agree.
The deeper issue is decision-making. In fast markets, hesitation is costly, and a screen full of competing readings makes it harder to act decisively. Traders with too many indicators often freeze when the tools disagree, or overtrade when they align, mistaking a crowded chart for thorough analysis. The discipline of fewer, well-chosen tools is what keeps analysis clear and actionable. As with the best indicators for day trading, less genuinely tends to be more, because clarity beats coverage when it is time to pull the trigger.
Putting indicator combinations in context
Combining indicators effectively is about balance, not abundance: one tool per dimension, mixed across categories so each adds new information. Trend, momentum, and volume together build a coherent read, while stacking similar oscillators only repeats one signal and clutters the chart.
The strongest approach picks a small, complementary set, learns how the tools behave together, and lets them confirm one another from different angles, always alongside price action. For a focused application, see the best indicators for day trading and best indicators for swing trading. Bullynx can also read a chart screenshot and explain what your combined indicators are signaling relative to the trend.
Frequently asked questions
- How do you combine indicators effectively?
- Combine indicators from different categories so each adds new information: a trend tool, a momentum tool, and a volume tool. Stacking several indicators from the same category, like three momentum oscillators, creates redundant, conflicting signals rather than confirmation.
- How many indicators should you use?
- Most traders find two to four indicators are enough. Beyond that, signals start to conflict and analysis paralysis sets in. The goal is to cover different dimensions of price action, not to stack as many tools as possible.
- What is indicator redundancy?
- Indicator redundancy is using multiple tools that measure the same thing, like the RSI, stochastic, and Williams %R together. They are all momentum oscillators built on similar math, so they mostly repeat the same signal and give a false sense of confirmation.
- What is a good indicator combination?
- A classic non-redundant combo pairs a trend tool (moving average or VWAP), a momentum tool (RSI or MACD), and a volume tool. Each answers a different question: which way is the trend, is momentum supporting it, and is there participation behind the move.
- Why is using too many indicators a problem?
- Too many indicators produce conflicting signals, slow down decisions, and create overconfidence when redundant tools agree. A cluttered chart makes it harder, not easier, to act, and often leads to overtrading or hesitation at key moments.
Not sure what your indicators are telling you? Upload your chart and Lynx AI reads the signals in context: trend, levels, and whether the indicator agrees with price.
Analyze my chart freeKeep reading
- Best Indicators for Day Trading (2026)Technical Indicators
- Best MACD Settings for Different TradersTechnical Indicators
- Best RSI Settings for Day & Swing TradingTechnical Indicators
- Bollinger Band Squeeze: Trade VolatilityTechnical Indicators
- CCI Indicator: Commodity Channel IndexTechnical Indicators
- Golden Cross vs Death Cross ExplainedTechnical Indicators
Educational only. Not financial advice. NFA. Bullynx is not a registered investment adviser or broker-dealer. Trading and investing involve significant risk of loss. Read the full risk disclosure.