
Crypto Technical Analysis: Beginner Guide
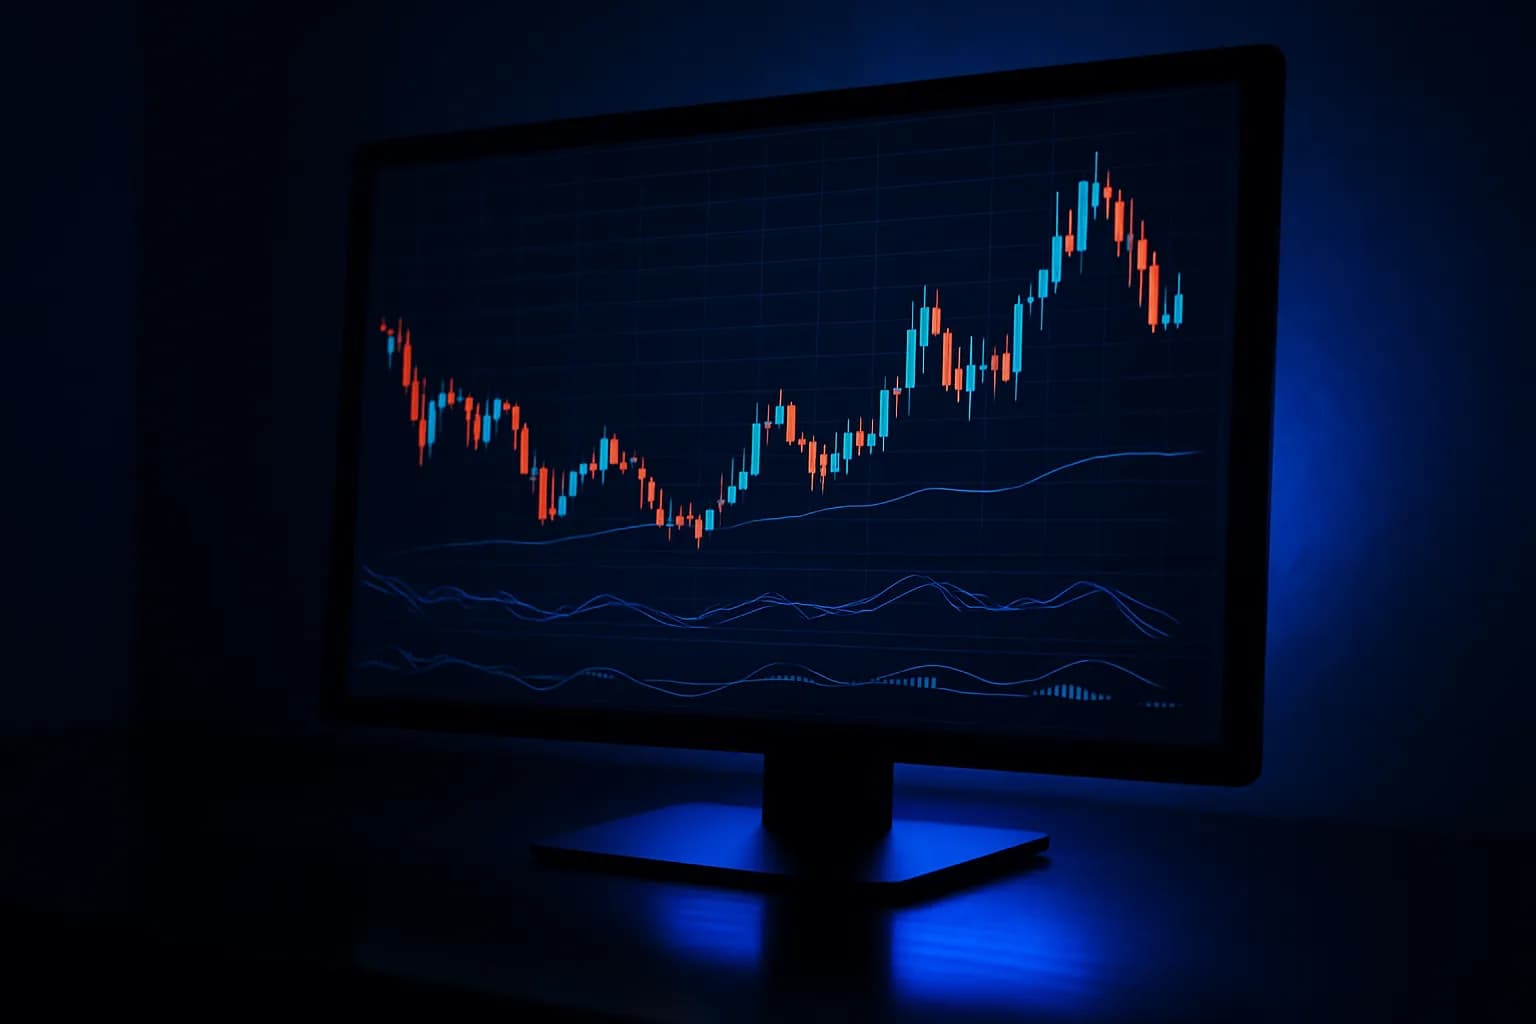
Crypto technical analysis applies the same toolkit as stock chart reading, trend, support and resistance, and indicators, to assets that trade 24/7 with far more volatility. The methods transfer directly, but the settings change: you favor higher timeframes, demand more confirmation, and tighten risk to handle the noise. This beginner guide lays out the workflow and the crypto-specific caveats.
Key takeaway
Why technical analysis suits crypto
Technical analysis works on crypto for a practical reason: crypto largely lacks the traditional fundamentals that anchor stock valuation, earnings, cash flow, dividends, so price, volume, and chart structure carry even more of the analytical weight. Many crypto traders rely heavily on the chart precisely because there is less of a fundamental backstop.
The core premise holds across markets. Technical analysis assumes price reflects available information, that prices move in trends, and that patterns of behavior recur. Those assumptions are not unique to stocks, which is why the same tools that read an equity chart read a crypto chart. Our how to read crypto charts guide covers the setup; this one covers the analytical workflow.
The crypto technical analysis workflow
The workflow mirrors stocks, executed with crypto's volatility in mind.
- Identify the trend. Higher highs and higher lows is up, lower highs and lows is down, flat is a range. Do this on a higher timeframe first for a clean read.
- Mark support and resistance. Use prior swing highs and lows, round numbers (which matter a lot in crypto), and high-volume areas.
- Check volume. Confirm that moves, especially breakouts, carry participation rather than drifting on thin volume.
- Add one or two indicators. A trend tool and a momentum tool are plenty to start.
- Demand confluence. On volatile crypto, wait for an indicator to agree with a level or the trend before acting.
The fifth step is the crypto-specific discipline. A single signal on a fast-moving asset throws more false positives, so requiring agreement between independent reads is what keeps you out of the noise.
Indicators that fit crypto
A few well-understood indicators do most of the work, and the rule of restraint matters even more on noisy crypto.
| Indicator | Job | Crypto note |
|---|---|---|
| Moving averages | Trend and dynamic S/R | 50 and 200 day widely watched on BTC |
| RSI | Momentum, overbought/oversold | Can stay stretched longer; widen bands |
| Support and resistance | Key reaction levels | Round numbers carry strong weight |
| Volume | Confirmation of moves | Watch for thin-hour false breaks |
For deeper coverage, the RSI and moving averages guides apply directly to crypto. Resist stacking a dozen studies; a cluttered chart of conflicting signals is worse than a clean one with two trusted tools.
Volatility caveats you cannot ignore
Crypto's defining feature for analysis is volatility, and it changes how you act on every signal.
- Wider stops, smaller positions. Stops sized for a stock get hit by normal crypto noise. Give trades room and size down to compensate.
- Higher timeframes for clarity. Lower timeframes are extremely noisy; the daily and 4-hour give cleaner, more reliable reads.
- Levels tested at all hours. With no daily close, a key level can break while you sleep, so alerts matter.
- Sharper false breaks. Thin liquidity at certain hours produces exaggerated wicks that fake a breakout.
How crypto TA differs from stocks
The methods are identical, but four differences shape their application. Crypto trades 24/7 with no session structure, is far more volatile, can have thinner liquidity at off-peak hours, and leans more heavily on technical and on-chain analysis given the lack of traditional fundamentals. The practical upshot is that the same RSI or moving-average signal demands more confirmation and tighter risk on crypto than on a blue-chip stock. Respect those differences and your stock-chart skills transfer cleanly.
The bottom line
Crypto technical analysis is not a separate discipline, it is the same chart-reading toolkit applied with stricter discipline. Identify the trend, mark the levels, confirm with volume, add a couple of indicators, and demand confluence, all while favoring higher timeframes and tight risk to handle the volatility. Beginners who master trend, support and resistance, and risk management on the daily chart have most of what they need; the rest is practice and patience.
Frequently asked questions
- Does technical analysis work for crypto?
- The same technical analysis tools used on stocks, trend, support and resistance, and indicators like RSI and moving averages, apply to crypto and behave similarly. Crypto's higher volatility and 24/7 trading produce more frequent and sharper signals, so analysis works but requires extra caution and confluence.
- How do you do technical analysis on crypto?
- Follow the same workflow as any chart: identify the trend, mark key support and resistance, check volume, then add one or two confirming indicators. Adjust for crypto's volatility by favoring higher timeframes and requiring signals to agree before acting. The process is identical; the risk settings are tighter.
- What is the best indicator for crypto?
- There is no single best indicator. Moving averages for trend, RSI for momentum, and support and resistance for levels all work well on crypto. The key is using a few you understand rather than stacking many. On volatile crypto, confluence between an indicator and a level beats any indicator alone.
- Is crypto technical analysis different from stocks?
- The methods are the same, but crypto trades 24/7 with no daily close, is more volatile, and can have thinner liquidity, which makes signals noisier and levels testable at any hour. Crypto also lacks the traditional fundamentals of stocks, so technical and on-chain analysis carry more weight.
- Can beginners learn crypto technical analysis?
- Yes. Start by mastering trend, support and resistance, and volume on higher timeframes, then add one indicator. Crypto's volatility makes discipline and risk management essential, but the core skills are learnable and transfer directly from stock chart reading.
Seeing this setup on your own chart? Upload the screenshot and Lynx AI maps the structure, the levels that matter, and a long or short bias, with what would invalidate it.
Keep reading
- Best Timeframe for Day Trading ChartsChart Reading & Patterns
- Best Timeframe for Swing TradingChart Reading & Patterns
- Break of Structure (BOS) in Trading, ExplainedChart Reading & Patterns
- Breaker Blocks ExplainedChart Reading & Patterns
- Breakout Trading Strategy: Entries and StopsChart Reading & Patterns
- Candlestick Patterns Cheat Sheet: The Key PatternsChart Reading & Patterns
Educational only. Not financial advice. NFA. Bullynx is not a registered investment adviser or broker-dealer. Trading and investing involve significant risk of loss. Read the full risk disclosure.