
Forex Technical Analysis for Beginners
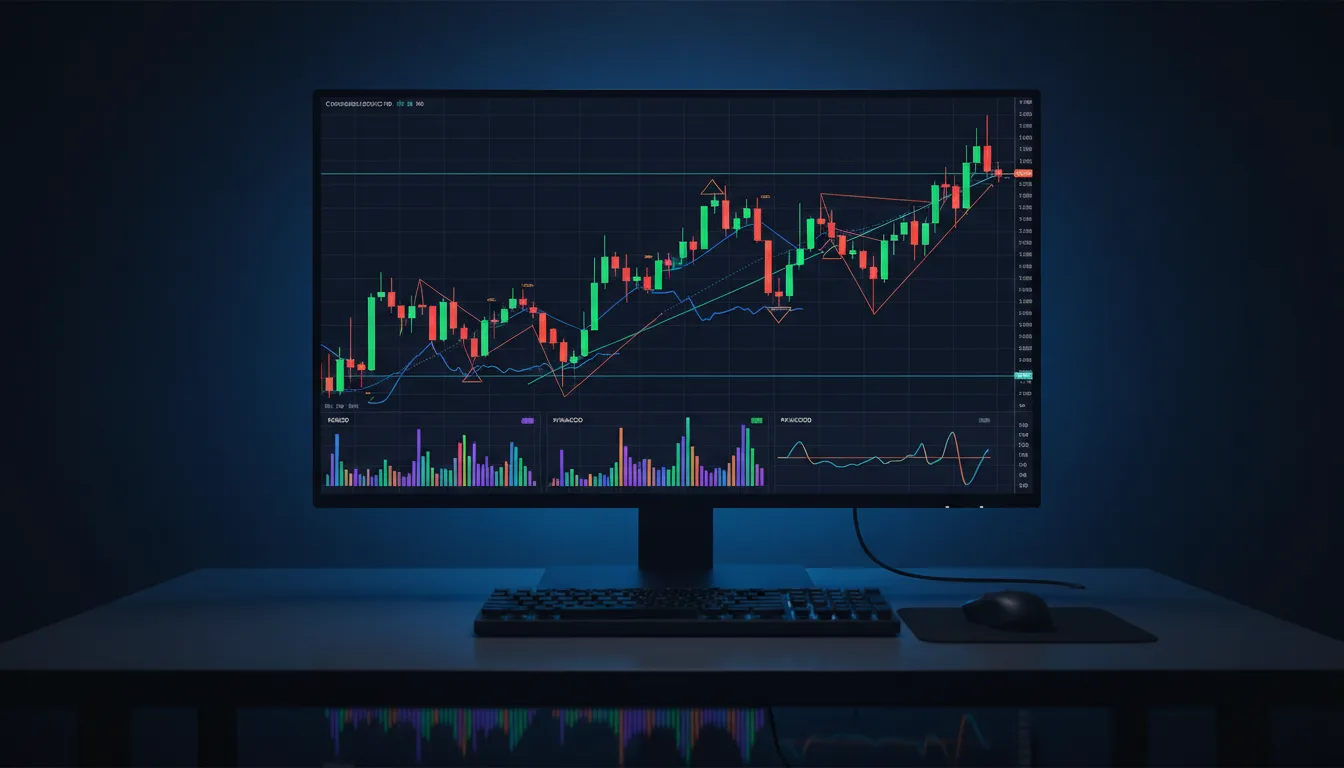
Forex technical analysis applies the standard chart-reading toolkit, trend, support and resistance, and indicators, to currency pairs, with two FX-specific factors: trading sessions that shape volatility through the day, and leverage that magnifies every move. Because forex is deeply liquid and widely watched, technical levels tend to be respected. This beginner guide covers the workflow and the risk discipline FX demands.
Key takeaway
Why technical analysis suits forex
Forex is among the most liquid markets in the world, with enormous daily volume concentrated in a handful of major pairs. That liquidity is exactly why technical analysis works well: when millions of participants watch the same widely followed levels, those levels become self-reinforcing and tend to be respected. A clean break of a major support or resistance in a liquid pair carries real meaning.
Forex is also heavily driven by macro forces, interest-rate expectations, economic data, and central-bank policy, that no chart captures directly. Technical analysis does not replace awareness of those drivers; it organizes the price action they produce. Our how to read forex charts guide covers the mechanics of pips and pairs; this one focuses on the analytical workflow.
The forex technical analysis workflow
The workflow mirrors any market, with session timing added.
- Identify the trend. On the pair's higher timeframe, decide whether the base currency is rising, falling, or ranging against the quote.
- Mark support and resistance. Use prior swing highs and lows, round numbers (which matter in FX), and prior session and weekly levels.
- Note the active session. Tokyo, London, or New York, and especially the London-New York overlap, set the volatility backdrop.
- Add one or two indicators. A trend tool and a momentum tool are enough to start.
- Size for leverage. Define your pip risk and position size before entering, because leverage amplifies the outcome.
Steps three and five are the forex-specific disciplines. Session awareness tells you when a move has conviction behind it, and leverage-aware sizing keeps a normal adverse move from becoming an outsized loss.
Trading sessions and timing
Forex trades 24 hours on weekdays, but activity is uneven, and that unevenness is part of the analysis.
- London session: the highest-volume window, where many major-pair trends develop and breakouts carry weight.
- New York session: active, especially during the London-New York overlap, the busiest period of the day.
- Tokyo session: quieter for most majors, more relevant for yen and Asia-Pacific pairs.
A breakout during the busy London-New York overlap is more trustworthy than the same move in a thin Asian session, where false breaks are more common. Knowing which session you are in helps you weight a signal correctly, an input stock traders rarely need to consider.
Indicators that fit forex
A few well-understood tools handle most FX analysis.
| Indicator | Job | FX note |
|---|---|---|
| Moving averages | Trend and dynamic S/R | 50 and 200 widely watched |
| RSI | Momentum and divergence | Useful across timeframes |
| Support and resistance | Key reaction levels | Round numbers carry weight |
| Session levels | Intraday structure | Prior session high/low matter |
The moving averages and RSI guides apply directly. Avoid stacking many studies; forex moves on macro drivers no oscillator captures, so a clean chart with a couple of trusted tools beats a cluttered one.
Managing leverage and risk
Leverage is the defining risk of forex and the reason risk management must lead. FX is commonly traded with significant leverage, which magnifies both gains and losses. A position that looks small can produce an outsized loss if the pair moves against you, which is how undercapitalized accounts blow up.
The discipline is to size from risk, not from how many lots you can afford. Decide how many pips your stop is away, convert that to account-currency risk with a pip value calculator, and size so a stop-out costs only a small, predefined fraction of your account.
The bottom line
Forex technical analysis is the familiar chart-reading toolkit applied to currency pairs, with trading sessions layered onto the timing and leverage looming over the risk. The market's deep liquidity makes levels and patterns reliable, which rewards disciplined technical work. Start on higher timeframes and major pairs, respect the sessions, keep leverage modest, and let risk management lead. Do that, and the currency markets become as readable as any other.
Frequently asked questions
- Does technical analysis work for forex?
- Yes. Forex is one of the most liquid, widely watched markets, so technical levels and patterns tend to be respected. The same tools used on stocks, trend, support and resistance, and indicators, apply directly to currency pairs, with the added factor of trading sessions that shape volatility through the day.
- How do you do forex technical analysis?
- Follow the standard workflow: identify the trend, mark support and resistance (including round numbers and session highs and lows), check the active trading session, and add one or two confirming indicators. Then size positions for the leverage involved before acting. The method mirrors stock analysis with session timing layered in.
- What is the best indicator for forex?
- There is no single best one. Moving averages for trend, RSI for momentum, and support and resistance for levels all translate well to forex. Many FX traders also watch session opens and round numbers. As always, a few well-understood tools beat a cluttered chart of conflicting signals.
- Why do trading sessions matter in forex?
- Forex trades 24 hours on weekdays through the Tokyo, London, and New York sessions, each with different liquidity and volatility. The London and London-New York overlap are the most active. A breakout during a busy session carries more weight than the same move in a thin session, so timing is part of the analysis.
- Is forex technical analysis good for beginners?
- Yes, with caution. The core skills transfer from stock chart reading and forex's liquidity makes levels reliable. The main risk for beginners is leverage, which magnifies losses. Start on higher timeframes and major pairs, use modest leverage, and prioritize risk management while learning.
Seeing this setup on your own chart? Upload the screenshot and Lynx AI maps the structure, the levels that matter, and a long or short bias, with what would invalidate it.
Keep reading
- Best Timeframe for Day Trading ChartsChart Reading & Patterns
- Best Timeframe for Swing TradingChart Reading & Patterns
- Break of Structure (BOS) in Trading, ExplainedChart Reading & Patterns
- Breaker Blocks ExplainedChart Reading & Patterns
- Breakout Trading Strategy: Entries and StopsChart Reading & Patterns
- Candlestick Patterns Cheat Sheet: The Key PatternsChart Reading & Patterns
Educational only. Not financial advice. NFA. Bullynx is not a registered investment adviser or broker-dealer. Trading and investing involve significant risk of loss. Read the full risk disclosure.