
Pennant Pattern: Quick Continuation Setup
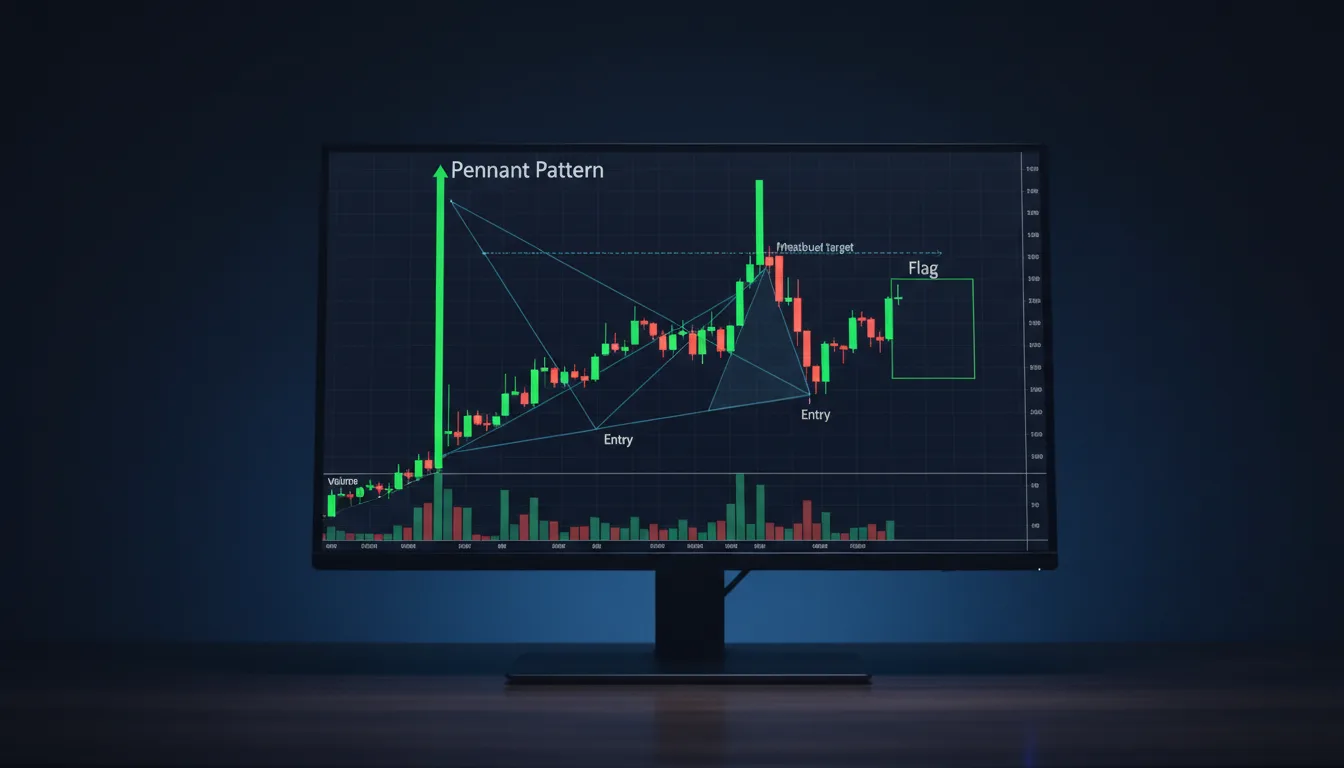
A pennant is a short continuation pattern that forms after a sharp price move called the flagpole. It looks like a small symmetrical triangle where price coils into a tight range before breaking out in the direction of the original move. A bullish pennant breaks higher; a bearish pennant breaks lower.
Key takeaway
What is a pennant pattern?
A pennant is a continuation pattern made of two parts: a sharp, near-vertical move known as the flagpole, and a small symmetrical triangle where price consolidates afterward. It signals that a strong, fast move paused briefly to digest before continuing in the same direction.
Pennants belong to the family of continuation setups covered in our guide to chart patterns. They are close cousins of flag patterns, differing mainly in the shape of the consolidation. The defining feature is the flagpole: without a sharp preceding move, a small converging triangle is just a triangle pattern, not a pennant.
What does a pennant look like?
A pennant has a tall flagpole followed by a brief, converging consolidation that resembles a tiny symmetrical triangle. The two trendlines of the pennant slope toward each other, one falling and one rising, capturing a quick balance between buyers and sellers.
- Flagpole. A steep, fast move in one direction, driven by a burst of one-sided pressure.
- Pennant. A short, tight triangle that forms immediately after, with converging upper and lower trendlines and contracting range.
- Breakout. A close beyond the pennant in the direction of the flagpole, ideally on rising volume, which resumes the move.
Where do you enter a pennant trade?
The standard entry is a breakout beyond the pennant in the direction of the flagpole, confirmed by a pickup in volume. For a bullish pennant that means a close above the upper trendline; for a bearish pennant, a close below the lower trendline.
Because pennants are brief, traders usually act quickly once the break confirms. A stop is often placed just on the other side of the pennant, since a move back through it suggests the continuation has failed. Anchoring the entry to a decisive close rather than an intraday spike helps avoid the false breaks that small patterns can produce, and keeps the risk on the trade tightly defined.
How do you set a price target?
The pennant target is measured by taking the height of the flagpole and projecting that distance from the breakout point in the direction of the trend. The result is a rough estimate of how far the continuation might run.
For example, if the flagpole rose 8 points and price breaks out of a bullish pennant near 18, the measured target is around 26. As with all measured moves, this is a guide rather than a guarantee. The strength of the underlying move, nearby resistance or support, and the volume on the break should all factor into how much weight you give the projection.
How does volume confirm a pennant?
Volume usually surges on the flagpole, contracts sharply during the pennant, and then expands again on the breakout. This burst-pause-burst rhythm is the signature of a healthy continuation pattern.
The volume contraction inside the pennant is reassuring: it suggests the pause is orderly profit-taking rather than a genuine shift in control. A breakout that arrives with rising volume confirms the dominant side is back in charge, while a breakout on thin volume is more prone to stall. Volume is not strictly required, but the contraction-then-expansion pattern is what separates a clean pennant from a sloppy one.
Pennant vs flag
A pennant and a flag are both short continuation pauses that follow a flagpole and break in the direction of the prior move. The difference is the shape of the consolidation.
| Feature | Pennant | Flag |
|---|---|---|
| Consolidation shape | Tiny converging triangle | Small rectangle / parallel channel |
| Trendlines | Converge toward each other | Roughly parallel |
| Preceded by | Flagpole | Flagpole |
| Breakout direction | Direction of the pole | Direction of the pole |
In practice the two are traded the same way, and many traders treat them as a single family. The pennant's converging lines also make it look like a small triangle, but the required flagpole is the cue that you are looking at a pennant continuation.
Putting the pennant in context
The pennant is a disciplined way to join a strong, fast move at a brief pause rather than chasing it. Its value comes from a checklist: a clear flagpole, a tight converging pennant on contracting volume, a confirmed breakout in the trend's direction, and a measured target treated as a guide.
If you are still learning to spot continuations, study flag patterns and triangle chart patterns, and ground yourself in support and resistance first. Bullynx can also read a chart screenshot and point out where a potential pennant sits relative to the flagpole and the prevailing trend.
Frequently asked questions
- What is a pennant pattern?
- A pennant is a short continuation pattern that forms after a sharp price move (the flagpole). It looks like a small symmetrical triangle where price coils into a tight range before breaking out in the direction of the original move. A bullish pennant breaks up; a bearish pennant breaks down.
- Is a pennant bullish or bearish?
- A pennant can be either. A bullish pennant follows a sharp rally and usually breaks higher; a bearish pennant follows a sharp drop and usually breaks lower. The pennant is a brief pause that continues the prior move.
- Where do you enter a pennant trade?
- The common entry is a breakout beyond the pennant in the direction of the flagpole, ideally on rising volume. A stop is often placed on the other side of the pennant, and the target is projected from the flagpole's height.
- What is the difference between a pennant and a flag?
- Both follow a flagpole and continue the trend. A flag is a small rectangle or parallel channel, while a pennant is a tiny converging triangle. They are traded the same way, with the breakout in the direction of the pole.
- How reliable is a pennant pattern?
- Pennants are widely used but not certain. A clear flagpole, a brief tight pennant on contracting volume, and a breakout on rising volume make for a stronger setup. Always confirm the break and manage risk.
Seeing this setup on your own chart? Upload the screenshot and Lynx AI maps the structure, the levels that matter, and a long or short bias, with what would invalidate it.
Keep reading
- Flag Pattern: Bull & Bear ContinuationChart Reading & Patterns
- Cup and Handle Pattern: How to Trade ItChart Reading & Patterns
- Double Bottom Pattern: Bullish ReversalChart Reading & Patterns
- Double Top Pattern: Bearish Reversal GuideChart Reading & Patterns
- Gap Trading: How to Trade Price GapsChart Reading & Patterns
- Head and Shoulders Pattern: How to Read ItChart Reading & Patterns
Educational only. Not financial advice. NFA. Bullynx is not a registered investment adviser or broker-dealer. Trading and investing involve significant risk of loss. Read the full risk disclosure.