
What Is Confluence in Trading? Zones and Factors
Last updated September 7, 2026
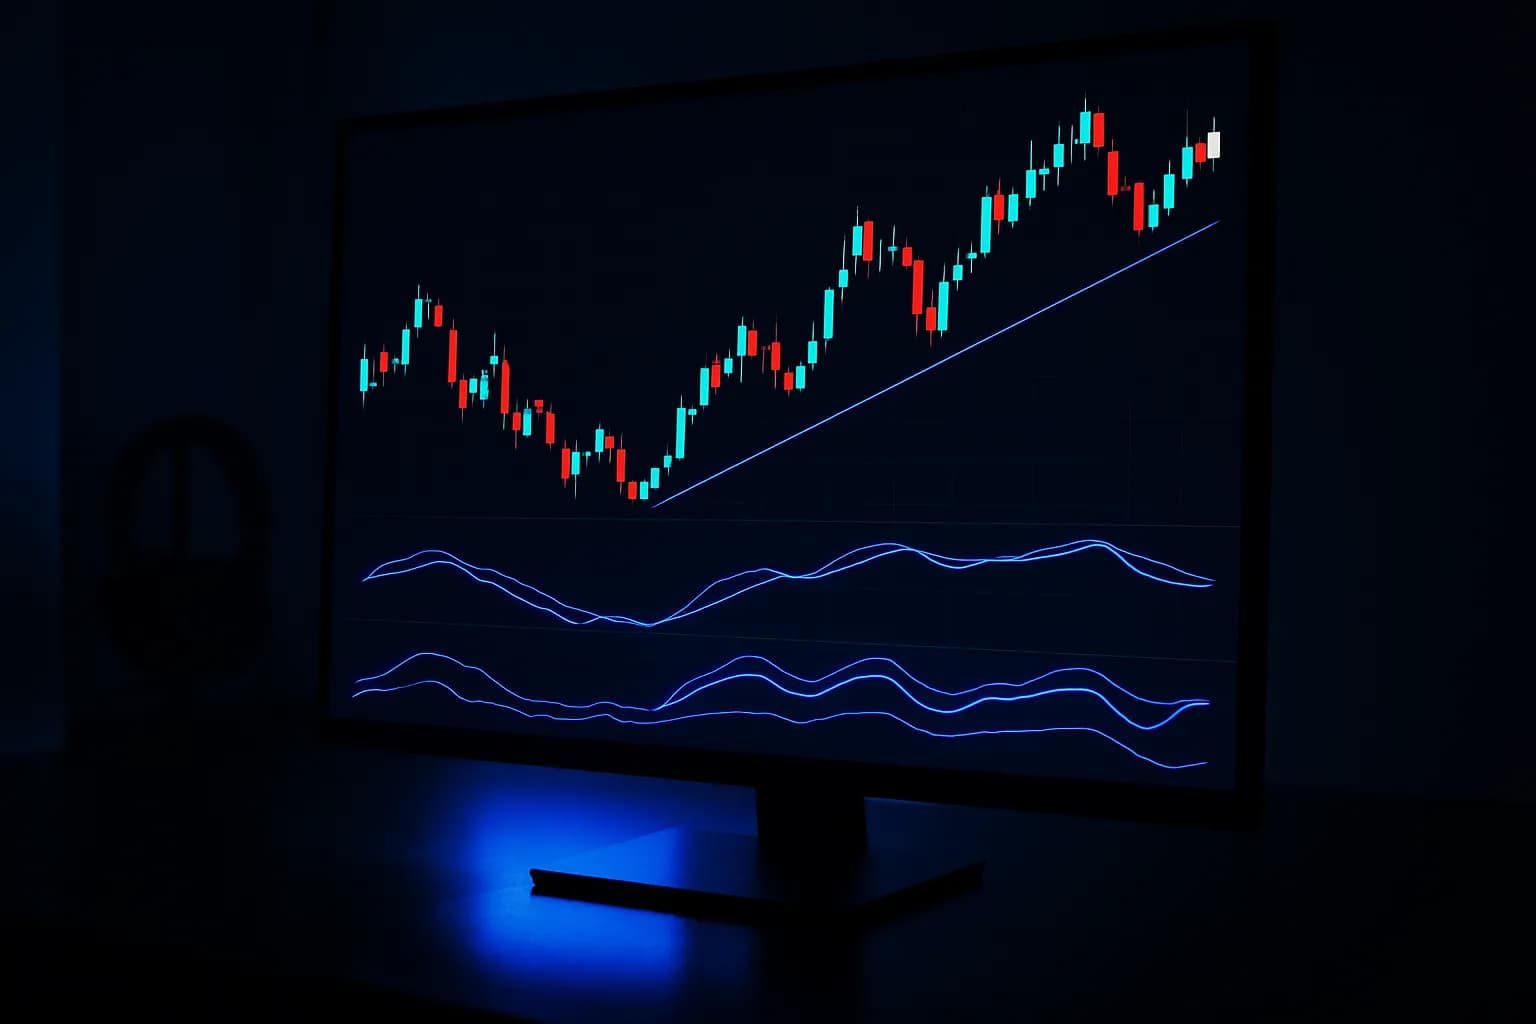
Confluence in trading means several independent signals pointing to the same conclusion at the same price area. A horizontal support, a rising trendline and a Fibonacci retracement meeting in one band form a confluence zone, and that zone carries a stronger case than any single factor alone. The point is selection: fewer setups, each with more reasons behind it.
Key takeaway
Confluence is multiple independent signals pointing to the same conclusion at the same place, support plus a Fibonacci level plus a trendline, for instance. Several aligned factors are less likely to be coincidence than one, so confluence raises trade quality and filters out weak setups. The trap is over-confluence: stacking too many or redundant signals, which leads to paralysis or false confidence rather than better odds.
What is confluence in trading?
Confluence in trading means several distinct signals converging on the same conclusion at the same price area. Rather than acting on a single read, like a lone support level, you look for a spot where multiple tools independently agree: a horizontal support, a rising trendline, a Fibonacci retracement, and a higher-timeframe level all clustering around one price. That cluster is a confluence zone, and it carries more weight than any one factor on its own.
The logic is probabilistic. Any single technical signal can be coincidental or fail, but when several independent methods point to the same level, the odds that they are all wrong at once are lower. Confluence is therefore a way of building a stronger case for a trade by demanding agreement from different angles, and it is one of the most practical ideas in technical analysis. It is the natural extension of seeking confirmation and applies across the whole price-action toolkit.
Why does confluence improve trade quality?
Confluence improves trade quality because it filters your setups, leaving only those with multiple reasons to work. A support level alone might be a coincidence; a support level that also sits at a key Fibonacci retracement, where a trendline arrives, and which aligns with the higher-timeframe trend, has four independent reasons price might react there. Each added independent factor that agrees strengthens the case and weeds out marginal trades.
This selectivity is where confluence earns its value. Most traders lose not from a lack of setups but from taking too many low-quality ones; confluence imposes a higher bar that naturally cuts the weak trades. By waiting for several factors to align, you trade less often but with better odds on each trade, which suits the reality that patience and quality beat frequency. The chart below shows a confluence zone where a horizontal level and a rising trendline meet.
The reaction at a confluence zone tends to be cleaner because more participants are watching the same area for the same reasons. This self-fulfilling element is part of why confluence works: when a price area is significant by several measures, traders using different methods all act there, concentrating orders and producing a more decisive reaction than a level only a few people are watching.
What counts as a confluence factor?
A confluence factor is any independent technical reason that points to the same level or direction. The common ones span the major schools of analysis: horizontal support and resistance, trendlines, Fibonacci retracements and extensions, moving averages, supply and demand zones, round numbers, candlestick reversal signals, and alignment with the higher-timeframe trend. The strongest confluence combines factors from genuinely different methods rather than several versions of the same one.
That independence is the key qualifier. Three moving averages clustering is weaker confluence than it looks, because they all measure the same thing, average price, and tend to agree by construction. A moving average, a Fibonacci level, and a structural support agreeing is stronger, because they derive from different logic. Mixing categories beats stacking redundant tools, as the table further down sets out. When listing your confluence factors, ask whether each adds a genuinely new angle or just echoes one you already have.
Which factors are genuinely independent?
This is the question that decides whether a confluence checklist is doing any work. Two factors are independent when they are computed from different inputs or describe different things about the market. They are correlated, and therefore count as roughly one factor, when they are different views of the same underlying number. Counting correlated signals as separate ones is the most common way traders overstate the strength of a setup.
| Combination | Independent? | Why |
|---|---|---|
| RSI oversold plus stochastic oversold | No | Both are momentum oscillators built from recent price change, so they usually agree by construction |
| 20 EMA plus 21 SMA plus 25 EMA | No | Three averages of almost the same length track almost the same line |
| Horizontal support plus a trendline drawn on the same swing lows | No | One set of lows, counted twice |
| Horizontal support plus a Fibonacci retracement plus higher-timeframe structure | Yes | Structure, a proportional measure and a different timeframe are three different inputs |
| A moving average plus a volume spike plus a candlestick rejection | Yes | Trend, participation and a single-bar reaction are unrelated measures |
The practical test is to ask what each factor would say if the others were wrong. If a factor cannot disagree with one already on your list, it is not adding evidence, it is repeating it. This is the same principle behind the indicator categories below, where mixing trend, momentum and volume beats stacking three tools from one category.
One more nuance: confluence is a zone, not a price. A trendline slopes, a moving average moves, and a Fibonacci level rarely lands on a round number, so in practice the factors cluster inside a band rather than on a single line. Defining that band in advance, and placing the invalidation beyond it rather than inside it, is what keeps a confluence trade from being stopped out by the width of its own zone.
Which indicators actually add a new angle?
The independence test above is easiest to apply if you sort your tools into categories first. Indicators fall into four, each measuring a different aspect of price, and a genuinely non-redundant combination draws one tool from each relevant category rather than several from one.
| Category | Measures | Examples |
|---|---|---|
| Trend | Direction and persistence | Moving averages, VWAP, ADX |
| Momentum | Speed and strength | RSI, MACD, ROC, stochastic |
| Volume | Participation | OBV, volume, money flow |
| Volatility | Range and stretch | Bollinger Bands, ATR, Keltner |
Three combinations hold up well in practice. Trend plus momentum plus volume is the classic: a moving average or VWAP for direction, RSI or MACD for strength, and volume for participation. Trend plus volatility pairs a moving average with Bollinger Bands to spot pullbacks and squeezes inside a trend. Trend strength plus entry uses ADX to confirm a trend exists at all, then a momentum or crossover tool for timing, which filters out range-bound chop.
The failure mode is redundancy: stacking several momentum oscillators, so that when all three flash oversold at once it feels like confirmation when it is one signal counted three times. If two indicators almost always agree, you only need one of them. Beyond the false confidence, a crowded chart slows decisions, and traders with too many tools tend to freeze when they disagree and overtrade when they align.
Confluence across timeframes, not just indicators
The other axis of confluence is scale. Multiple timeframe analysis reads a higher timeframe for the dominant trend and major levels, then a lower one for entry timing. A setup that looks bullish up close is often a small bounce inside a larger downtrend, and only the zoomed-out view shows that.
The workflow runs top down, so context is set before timing:
- Highest timeframe (context). Establish the dominant trend and the major support and resistance. This sets the bias: long, short, or aside.
- Middle timeframe (setup). Find a setup that agrees with that bias, such as a pullback to support inside an uptrend.
- Lowest timeframe (timing). Refine the entry with a candlestick confirmation or a momentum turn, and place a logical stop.
Space the timeframes far enough apart to show genuinely different pictures, commonly a factor of four to six. A 15-minute and a 30-minute chart show the same thing twice.
| Style | Higher (trend) | Middle (setup) | Lower (entry) |
|---|---|---|---|
| Position | Monthly | Weekly | Daily |
| Swing | Weekly | Daily | 4-hour |
| Day | Daily | 1-hour | 5-15 min |
Two or three timeframes is plenty. The rule that makes this work is that lower timeframes serve higher ones and never override them: when they disagree, the higher one wins or you stand aside.
The most common failure here is timeframe shopping: dropping to ever-lower charts until one justifies the trade you already wanted. That is bias wearing the costume of analysis. Decide the bias on the higher timeframe first, then let the lower one only time an entry that agrees with it.
What is the over-confluence trap?
The over-confluence trap is the mistake of demanding so much agreement that the method backfires. It takes two forms. The first is paralysis: if you require five or six factors to align before trading, you will rarely find a setup that qualifies, and you miss good trades waiting for a perfect storm that seldom comes. Markets do not always offer textbook confluence, and insisting on it can keep you on the sidelines indefinitely.
The second form is false confidence through cherry-picking. If you keep adding indicators until enough of them agree with the trade you already wanted, you have not built real confluence, you have engineered a justification. Piling on redundant or selectively chosen signals creates the feeling of a strong setup without the substance, which is more dangerous than too few signals because it disguises a weak trade as a strong one. The discipline is to define a small set of genuinely independent factors in advance and require meaningful, not maximal, agreement.
More signals are not always better. Stacking redundant indicators or cherry-picking until they agree gives false confidence, not better odds. Use a few independent factors and require real agreement, not a long checklist engineered to confirm a bias.
Putting confluence in context
Confluence trading is fundamentally about quality over quantity: taking fewer trades, but ones where multiple independent reads agree, so each has a stronger case. It is the unifying principle behind much of price-action trading, the reason a support level matters more when a trendline and a Fibonacci level meet it, and the filter that keeps a disciplined trader from chasing every marginal setup.
The balance to strike is between enough confluence to raise your odds and so much that you either never trade or fool yourself with redundant agreement. Define a handful of genuinely different factors, require a meaningful cluster of them, and still anchor every confluence trade to a stop beyond the invalidation, since even a strong zone can fail. Used with that judgment, confluence is one of the most reliable ways to improve trade selection, drawing together Fibonacci retracement, support and resistance, and the structure-and-zone tools across this cluster.
A good way to operationalize confluence is to write down, in advance, the small set of factors that constitute a valid setup for you, then grade each potential trade against that list rather than improvising. This turns confluence from a vague feeling of agreement into a concrete checklist you apply consistently, which both raises your standard and removes the temptation to rationalize a weak trade. Over time, reviewing which combinations of factors actually preceded your best trades, via a journal, lets you refine the list toward the confluence that genuinely works for your markets and style, rather than the textbook ideal. Confluence, done well, is as much a record-keeping discipline as a chart-reading one.
What an AI chart reader can and cannot see in a confluence zone
Confluence is partly geometry and partly judgement, and the split matters when the input is a screenshot. From an image, a model like Bullynx can mark the horizontal levels that price has reacted to inside the visible window, fit trendlines to the swings, note where a moving average line drawn on the chart crosses a level, read an oscillator pane if that pane is actually in the picture, and point out where two or more of those things land in the same band. Listing candidate factors and where they cluster is a reasonable use of a chart reader.
What it cannot do is decide, on your behalf, that those factors are independent. If a screenshot shows RSI and a stochastic in two panes, a model can report that both are stretched, but a naive count would call that two factors when it is closer to one, so the reasoning matters more than the tally. Beyond the frame, higher-timeframe structure is invisible unless you supply that chart too, and much of the strongest confluence is exactly that: a daily level seen on an hourly setup. It cannot see a Fibonacci retracement, an anchored VWAP or a supply zone that you have not drawn on the image, because those depend on anchor points a model has no way to know you chose. And no reader can tell you whether a zone will hold. The useful output is an inventory of what lines up and where the band sits, with the independence check and the invalidation left to you. For the underlying tools, see the technical indicators library.
Educational only. Not financial advice. Confluence improves the case for a trade but does not guarantee it; aligned signals can still fail. Examples use illustrative data. Always do your own research.
Frequently asked questions
- What is confluence in trading?
- Confluence is when multiple independent signals point to the same conclusion at the same price area, strengthening the case for a trade. For example, a support level, a Fibonacci retracement, and a trendline all meeting at one price form a confluence zone.
- Why does confluence improve trade quality?
- Because several aligned signals are less likely to be coincidental than one alone. A level confirmed by independent tools has a stronger case, so confluence filters out weaker setups and focuses you on higher-probability ones.
- What counts as a confluence factor?
- Common factors include support or resistance, trendlines, Fibonacci levels, moving averages, supply or demand zones, candlestick signals, and higher-timeframe alignment. The more independent the factors, the stronger the confluence.
- Can you have too much confluence?
- Yes. Over-confluence means stacking so many conditions that you rarely trade, or cherry-picking indicators until they agree. Quality confluence uses a few independent factors; piling on redundant ones gives false confidence, not better odds.
- How many confluence factors should a trade have?
- There is no fixed number, but two or three strong, independent factors aligning is often enough. The aim is meaningful agreement from different angles, not a long checklist of overlapping signals.
- What is confluence in forex trading?
- The idea is identical on currency pairs: several independent reads agreeing at one price area. Two factors specific to forex are worth adding to the list, session structure, since London and New York opens concentrate activity at predictable times, and correlated pairs, since a level that lines up across two pairs sharing a currency is stronger evidence than the same level on one chart alone.
- What is a confluence zone?
- A confluence zone is the price area, not the exact price, where several factors cluster. Trendlines slope, moving averages move and Fibonacci levels rarely land on the tick, so in practice you get a band a few points or pips wide rather than a single line. Treating it as a zone is what makes the idea usable.
- Which confluence factors are not actually independent?
- Any two tools computed from the same input tend to agree by construction. Two momentum oscillators such as RSI and the stochastic will usually say the same thing, several moving averages of similar length cluster together, and a trendline drawn along the same swing lows as a horizontal support is one level counted twice. None of these pairs adds a second angle.
- Does confluence guarantee a trade will work?
- No. Confluence improves selection, not certainty. A zone where four factors agree can still fail, and when it does it often fails hard, because many participants were positioned there. Every confluence trade still needs an invalidation level defined before entry.
- Which indicators work well together?
- One from each category, not several from one. A trend tool (a moving average, VWAP or ADX), a momentum tool (RSI or MACD) and a volume tool cover three genuinely different questions: direction, strength and participation. Stacking RSI, stochastic and Williams %R is one signal repeated three times.
- What is multiple timeframe analysis?
- Reading the same asset on a higher timeframe for trend and a lower one for entry timing, usually with a factor of four to six between them. The higher timeframe sets the bias and the lower one only times an entry that agrees with it. It is confluence across scales rather than across indicators.
About this byline
Markets & product research
The Bullynx editorial team researches and reviews the trading concepts, indicators, and tools we write about. Our articles are educational and are reviewed for accuracy before publishing. They are not financial advice.
Seeing this setup on your own chart? Upload the screenshot and Lynx AI maps the structure, the levels that matter, and a long or short bias, with what would invalidate it.
Keep reading
- Best Timeframe for Day Trading ChartsChart Reading & Patterns
- Best Timeframe for Swing TradingChart Reading & Patterns
- Break of Structure in Trading: How to Spot a Valid BOSChart Reading & Patterns
- Breakout Trading Strategy: Entry, Stop and TargetChart Reading & Patterns
- Evening Star Pattern: Bearish 3-Candle TopChart Reading & Patterns
- Fibonacci Retracement for Crypto: How to Draw ItChart Reading & Patterns
Educational only. Not financial advice. NFA. Bullynx is not a registered investment adviser or broker-dealer. Trading and investing involve significant risk of loss. Read the full risk disclosure or how this article was researched and reviewed.