
Keltner Channel vs Bollinger Bands
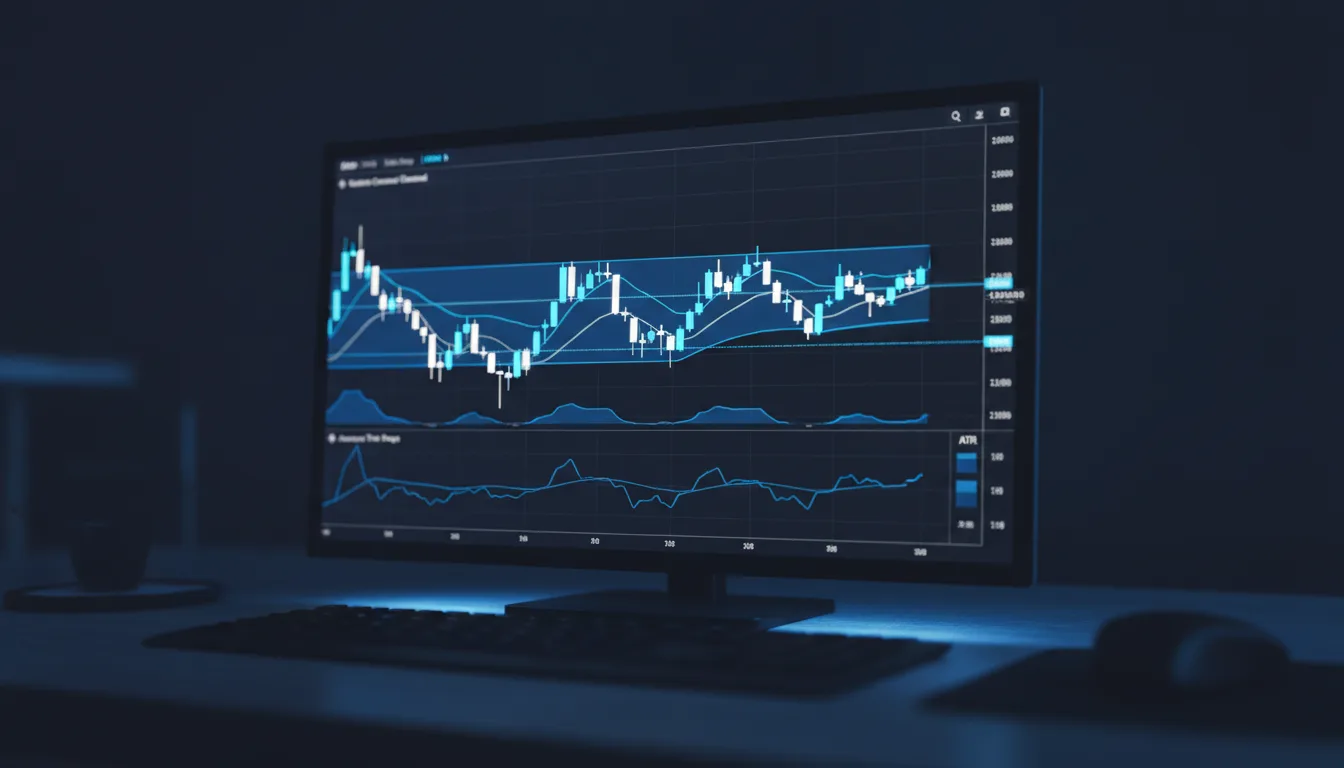
A Keltner Channel is a volatility-based indicator made of three lines: an exponential moving average in the middle, with upper and lower bands set a multiple of the Average True Range (ATR) away. The bands expand and contract with volatility, framing price within a smooth channel that traders use for both breakouts and pullbacks.
Key takeaway
What is a Keltner Channel?
A Keltner Channel is a volatility overlay that places a band above and below a moving average, with the band width driven by the Average True Range. Named after Chester Keltner and later refined by Linda Bradford Raschke, it frames price within a channel that adapts as volatility changes.
The indicator sits among the volatility technical indicators, and it is most often compared with Bollinger Bands, which solve the same problem with different math. Because the bands are tied to the ATR, they widen in volatile conditions and narrow in calm ones, giving a consistent read of how stretched price is relative to its recent range.
How is a Keltner Channel calculated?
A Keltner Channel uses three lines built from an EMA and the ATR. The middle line is a moving average, and the bands sit a fixed multiple of the ATR above and below it.
Middle Line = 20-period Exponential Moving Average (EMA)
Upper Band  = Middle Line + (2 x 10-period ATR)
Lower Band  = Middle Line - (2 x 10-period ATR)
The middle line is typically a 20-period EMA of closing prices, making it more responsive than a simple average. The bands sit a multiple (commonly 2) of the ATR away. Because ATR measures the average size of recent price ranges, the channel widens smoothly when ranges expand and tightens when they contract, without the sharp reactions that standard deviation can produce.
How do you read a Keltner Channel?
Reading the channel depends on the market regime. In a trend, the channel acts as a momentum guide; in a range, it acts as a mean-reversion frame.
- Breakout reading. A close outside the upper band in an uptrend, or below the lower band in a downtrend, suggests momentum strong enough to continue in that direction.
- Mean-reversion reading. Within a range, a tag of the upper band can mark a pullback opportunity back toward the middle, and a tag of the lower band the reverse.
- The middle EMA. Often acts as dynamic support in uptrends and resistance in downtrends, a level price pulls back to before resuming.
The right interpretation depends on whether price is trending or ranging, so a trend read should always come first.
Keltner Channel vs Bollinger Bands
Keltner Channels and Bollinger Bands both wrap price in volatility bands, but they measure volatility in fundamentally different ways. That difference shapes how the bands behave.
| Feature | Keltner Channel | Bollinger Bands |
|---|---|---|
| Volatility measure | Average True Range (range) | Standard deviation (price) |
| Middle line | EMA (typically 20) | SMA (typically 20) |
| Band behavior | Smoother, steadier | More reactive to spikes |
| Typical width | Narrower | Wider during volatile spikes |
Because Keltner bands use ATR, they are smoother and less prone to the sudden flaring that Bollinger Bands show when a single big candle inflates the standard deviation. Many trend traders prefer Keltner Channels for this steadiness, while Bollinger Bands' sharper reaction can be useful for spotting volatility extremes. Neither is strictly better; they answer the same question with different sensitivities.
Can you combine the two?
Yes, and one of the most popular setups overlays both. When the Bollinger Bands contract to sit entirely inside the Keltner Channel, it signals an unusually low-volatility squeeze, a compression that often precedes a larger move.
This combination, popularized as the "TTM squeeze," uses the two indicators' different volatility measures as a cross-check. Bollinger Bands, being more reactive, pull in faster during quiet periods, so when they fall within the steadier Keltner bands, volatility is genuinely compressed. Traders watch for the bands to expand back outside the channel as the cue that the squeeze is releasing, then trade the breakout in the direction price takes.
Putting Keltner Channels in context
Keltner Channels are a smooth, ATR-based way to frame price within its volatility, useful for both trend-following breakouts and range-bound pullbacks. Their steadiness relative to Bollinger Bands makes them a favorite for traders who want a calmer read of the channel.
The strongest use starts by identifying the regime, then applies the channel accordingly: breakouts in trends, mean-reversion in ranges, and the middle EMA as dynamic support and resistance. Pairing Keltner with Bollinger Bands or the ATR sharpens the volatility read. Bullynx can also read a chart screenshot and explain what a channel touch or squeeze implies in context.
Frequently asked questions
- What is a Keltner Channel?
- A Keltner Channel is a volatility-based indicator made of three lines: an exponential moving average in the middle, with upper and lower bands set a multiple of the Average True Range (ATR) away. The bands expand and contract with volatility, framing price within a channel.
- What is the difference between Keltner Channels and Bollinger Bands?
- Both wrap price in volatility bands, but they measure volatility differently. Keltner Channels use ATR (average range), producing smoother, steadier bands. Bollinger Bands use standard deviation of price, which reacts more sharply to volatility spikes. Keltner bands are usually narrower and smoother.
- How do you trade with a Keltner Channel?
- Two common approaches: trend-following, where a close outside the channel signals a breakout in that direction, and mean-reversion, where touches of the bands within a range are faded back toward the middle. The middle EMA also acts as dynamic support or resistance.
- What are the default Keltner Channel settings?
- A common setting is a 20-period EMA with bands placed at twice the 10-period ATR, though variations exist. Increasing the ATR multiplier widens the channel; decreasing it tightens it. The defaults work across most timeframes.
- Can you combine Keltner Channels and Bollinger Bands?
- Yes. A popular setup overlays both: when Bollinger Bands contract inside the Keltner Channel, it signals a low-volatility squeeze that often precedes a breakout. The two together help confirm volatility compression more reliably than either alone.
Not sure what your indicators are telling you? Upload your chart and Lynx AI reads the signals in context: trend, levels, and whether the indicator agrees with price.
Analyze my chart freeKeep reading
- Best Indicators for Day Trading (2026)Technical Indicators
- Best MACD Settings for Different TradersTechnical Indicators
- Best RSI Settings for Day & Swing TradingTechnical Indicators
- Bollinger Band Squeeze: Trade VolatilityTechnical Indicators
- CCI Indicator: Commodity Channel IndexTechnical Indicators
- How to Combine Indicators Without OverloadTechnical Indicators
Educational only. Not financial advice. NFA. Bullynx is not a registered investment adviser or broker-dealer. Trading and investing involve significant risk of loss. Read the full risk disclosure.