
Imbalance in Trading: Fair Value Gaps Explained
Last updated September 4, 2026
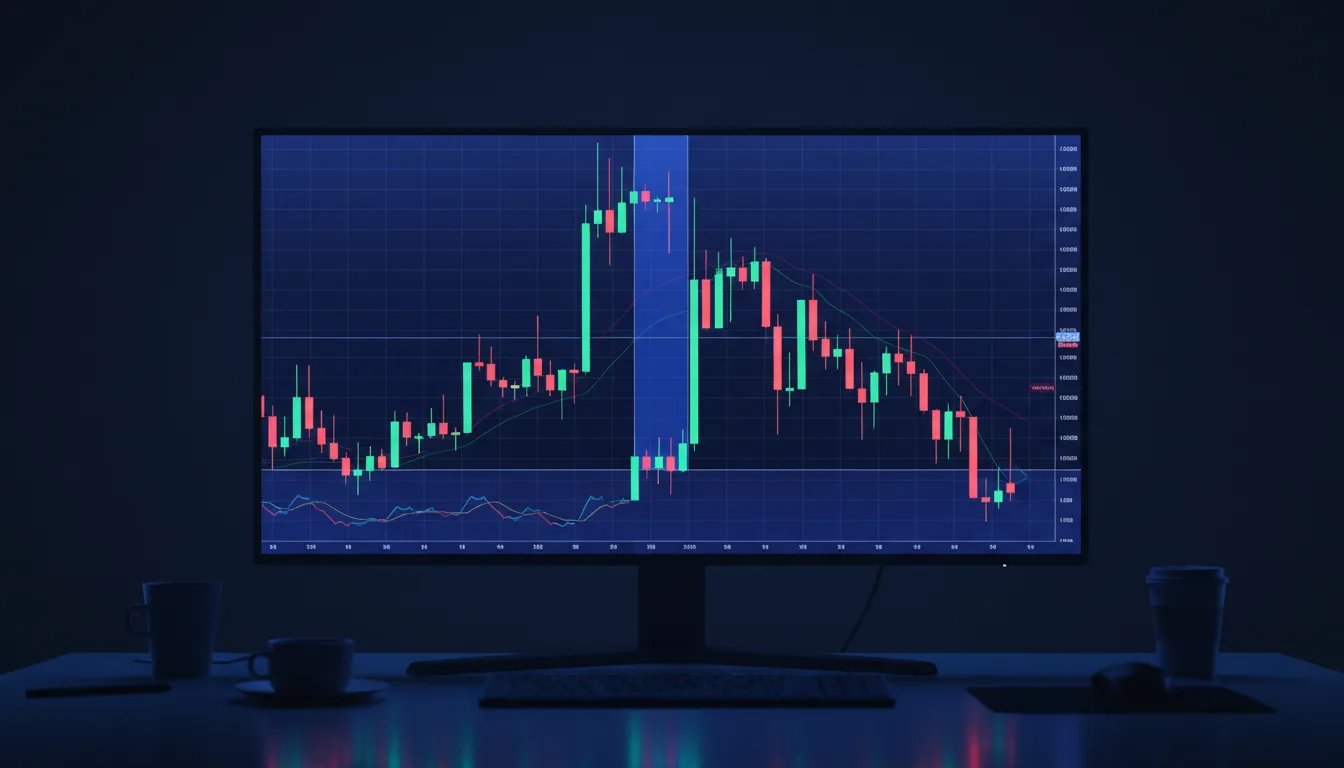
An imbalance is a price range that price crossed so fast that one side of the market barely traded there. On candles it shows up as a fair value gap, the untraded band between the first and third candle of a three-candle impulse. Price often returns to that band later, though not always.
Key takeaway
An imbalance is a zone of one-sided, rapid price movement that left little trading on the opposite side, an inefficiency. A fair value gap (FVG) is the three-candle footprint that marks it. Because the area was skipped over, price often revisits it to fill the imbalance before continuing, making the zone a potential entry area. Filling is common but never guaranteed.
What is an imbalance?
An imbalance is a stretch of price where one side of the market overwhelmed the other so completely that price raced through with little resistance, leaving a thin, one-sided range behind. In efficient trading, buying and selling roughly trade off at each price; in an imbalance, that two-sided trading did not happen, because aggressive orders pushed price through too fast. The result is an inefficiency, a zone the market may later return to "balance."
The concept borrows from order-flow thinking: a fast, one-directional move means orders on the opposite side went unfilled in that range. Markets have a tendency, though not a rule, to revisit such areas to complete the trading that did not occur, which is why imbalances are watched as likely reaction zones. The idea is central to smart money concepts and closely tied to the gap behavior covered in gap trading strategies, but it applies intraday, not just to overnight gaps.
Imbalance vs fair value gap
An imbalance and a fair value gap (FVG) describe the same phenomenon at different levels of precision. The imbalance is the general idea, a one-sided, inefficient move. The fair value gap is the specific, chartable pattern that marks it: a three-candle formation where a strong middle candle moves so fast that the wicks of the candle before and the candle after do not overlap, leaving a visible gap in the middle candle's range.
That non-overlap is the footprint of the imbalance. The gap between the first candle's wick and the third candle's wick is the inefficiency, the range price moved through without two-sided trading. Identifying FVGs gives you a precise, repeatable way to mark imbalances on a chart rather than eyeballing "fast moves." Our fair value gaps explained guide covers the exact pattern and how to draw it; here the focus is on what the imbalance means and how price tends to treat it. The benefit of having a precise definition is consistency: rather than each trader judging "fast" differently, the FVG gives an objective rule that two people can apply and agree on, which makes the concept teachable and testable rather than purely intuitive.
Why do imbalances get filled?
Imbalances tend to get filled because the rapid move left the area under-traded, and markets gravitate toward completing that unfinished business. When price rockets through a range, the orders that would normally have traded on the other side were skipped, so a later return to that range lets those trades happen, "balancing" the inefficiency. Traders describe the imbalance as acting like a magnet drawing price back.
That said, "tend to" is doing real work. Filling is a common tendency, not a law: some imbalances fill quickly, some fill partially, and some are never revisited because the trend simply runs away. Treating fills as guaranteed is a classic error that leads to fighting strong trends, waiting for a pullback into an imbalance that never comes. The chart below shows a fast move leaving an imbalance, then a return to fill it.
How do traders use imbalances?
Traders use imbalances mainly as potential entry zones in the direction of the prevailing trend. After an imbalance forms during a strong move, they watch for price to return to it, expecting a reaction, and look to enter in the trend's direction as price fills the gap, with a stop beyond the point where the imbalance and the idea would be invalidated. The imbalance functions as a support or resistance area created by order-flow inefficiency.
The strongest setups combine the imbalance with other reads: an imbalance that sits within a clear trend, aligns with a structural level, or coincides with a supply or demand zone is more compelling than one in isolation. As with all price-action tools, the imbalance is a zone to watch for a reaction, not an automatic trigger; you still want confirmation that buyers or sellers are stepping in as price fills it. Because not every imbalance fills, and some fill and keep going, strict risk control on every imbalance-based entry is essential. This pairs naturally with break of structure trading for trend confirmation.
Imbalances tend to fill but do not always. Waiting for a pullback into an imbalance can mean missing a strong trend that never returns. Treat fills as a tendency to trade with confirmation and a stop, not a certainty to rely on.
Can an AI chart reader find imbalances in a screenshot?
Yes, and this is one of the better cases for it, because a fair value gap is defined by a mechanical rule over three adjacent candles rather than by judgement. Given a clear screenshot, an image-based reader can scan the impulse legs, check the first-to-third candle relationship, and outline the bands that qualify. It will find the small ones you skipped, which is useful, since traders tend to mark only the gap they were already looking for.
The limits are about relevance rather than detection. It cannot tell you which of the six imbalances in the image the market cares about, because that depends on the higher-timeframe range the screenshot does not show. It cannot see gaps that formed before the left edge of the crop, and those older, larger ones often matter more. And on a compressed or low-resolution screenshot, adjacent wicks blur together, so a marginal gap may be a rendering artefact rather than a real one. Ask it to list what it sees and to say how large each band is, then decide relevance yourself. The AI chart analysis workflow is built for that division.
Putting imbalance in context
Imbalance trading is a way of reading the footprints that fast, one-sided moves leave on a chart and anticipating where price may react. By marking the inefficiencies, most precisely as fair value gaps, you identify zones the market has a tendency to revisit, which can offer high-quality entry areas when they align with the trend and structure. It is a refinement of support-and-resistance thinking grounded in order-flow logic.
The discipline that keeps it useful is the same that governs the rest of this toolkit: mark genuine imbalances, favor those aligned with the dominant trend, wait for a reaction on the return rather than assuming a fill, and anchor every entry to a stop beyond the invalidation. Treated as a probabilistic tendency within a broader price-action read, not as a guaranteed magnet, imbalances add a useful lens. They sit alongside fair value gaps explained, order blocks explained, and liquidity grab trading in the smart-money cluster.
It also helps to distinguish imbalances by their context, because not all are equal. An imbalance left during a strong, trend-confirming move, ideally one that coincides with a break of structure, is more meaningful than one formed in choppy, directionless price, where the "inefficiency" may simply be noise. The strongest imbalance setups are those that mark the origin of a genuine trend leg and sit within a clear directional bias. Reading imbalances without that context, treating every fast candle as a tradable gap, is how the concept gets misapplied. Tying each imbalance back to the larger market structure and trend is what turns it from a curiosity into a usable edge.
Educational only. Not financial advice. Imbalances and fair value gaps are descriptive concepts with a tendency, not a guarantee, to fill. Examples use illustrative data. Always do your own research.
Frequently asked questions
- What is an imbalance in trading?
- An imbalance is a price area where buying or selling was so one-sided that price moved quickly through it, leaving little trading on the other side. It represents an inefficiency, a zone price often revisits later to 'fill' before continuing.
- What is the difference between an imbalance and a fair value gap?
- They are closely related. A fair value gap (FVG) is a specific three-candle pattern that marks an imbalance, where the middle candle's range is not overlapped by the wicks of the candles on either side. The FVG is the visible footprint of an imbalance.
- Why do imbalances get filled?
- Because the rapid one-sided move left unfilled orders and little trading in that range, price often returns to trade through it, balancing the inefficiency. Filling is common but not guaranteed; some imbalances are never revisited.
- How do traders use imbalances?
- Traders watch for price to return to an imbalance as a potential entry zone in the direction of the original trend, expecting a reaction. The imbalance acts like a magnet and a support or resistance area combined.
- Is an imbalance the same as a gap?
- A classic gap is a price jump between sessions with no trading in between. An imbalance is a similar inefficiency that can occur intraday within a fast move, marked by a fair value gap, even when no overnight gap exists.
- How do you find an imbalance on a chart?
- Look for a run of large candles moving one way, then check the three-candle window at its centre: if the first candle's high sits below the third candle's low in an up move, the untraded band between them is the imbalance. In a down move, check whether the first candle's low sits above the third candle's high.
- Is a gap the same as an imbalance?
- Not quite. A classic gap is a jump between one session's close and the next session's open, with no trading at all in between. An imbalance is the same idea inside continuous trading: price crossed the range so quickly that one side of the book barely participated, leaving a fair value gap on the candles.
- Do all imbalances get filled?
- No. Filling is common enough to be worth watching for but it is not a rule, and strongly trending markets leave imbalances behind for months. Treating an unfilled gap as a guaranteed target is the most common way traders lose money on this concept.
- What is the difference between an imbalance and an order block?
- An imbalance is the empty space the impulse crossed. An order block is the last opposite-direction candle just before that impulse started. They usually sit next to each other, and many traders use the overlap of the two as the entry zone rather than either one alone.
About this byline
Markets & product research
The Bullynx editorial team researches and reviews the trading concepts, indicators, and tools we write about. Our articles are educational and are reviewed for accuracy before publishing. They are not financial advice.
Seeing this setup on your own chart? Upload the screenshot and Lynx AI maps the structure, the levels that matter, and a long or short bias, with what would invalidate it.
Keep reading
- Fair Value Gap Trading: What FVGs AreChart Reading & Patterns
- Best Timeframe for Day Trading ChartsChart Reading & Patterns
- Best Timeframe for Swing TradingChart Reading & Patterns
- Break of Structure in Trading: How to Spot a Valid BOSChart Reading & Patterns
- How to Read Volume on Crypto ChartsChart Reading & Patterns
- Renko Charts Explained: Bricks, Size and LimitsChart Reading & Patterns
Educational only. Not financial advice. NFA. Bullynx is not a registered investment adviser or broker-dealer. Trading and investing involve significant risk of loss. Read the full risk disclosure or how this article was researched and reviewed.