
Wyckoff Method: Accumulation and Distribution Explained
Last updated September 4, 2026
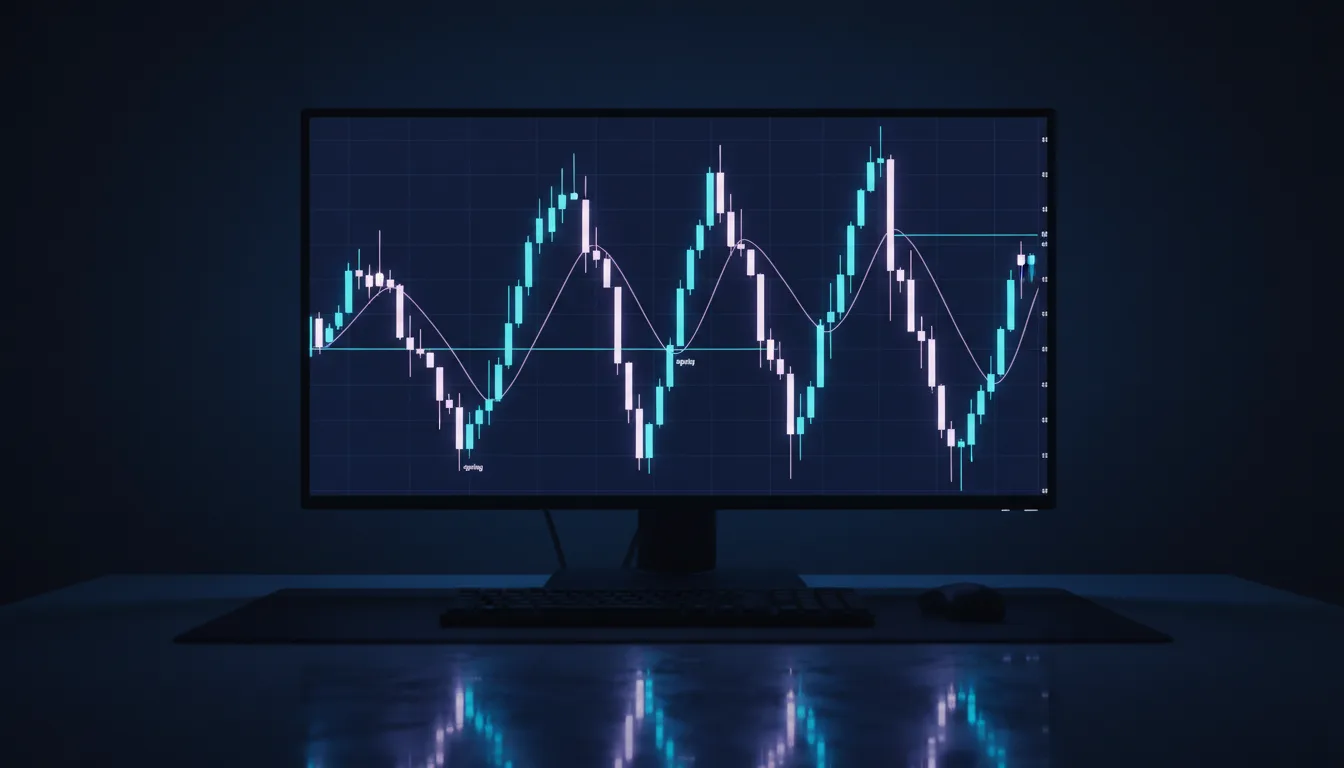
Wyckoff accumulation is a trading range after a decline in which large operators quietly buy before price marks up. Wyckoff distribution is the mirror: a range after an advance in which they quietly sell before price marks down. Both unfold in five phases, A to E, readable through price and volume.
Key takeaway
Wyckoff reads markets as cycles of accumulation (large operators quietly buying after a decline) and distribution (quietly selling after an advance), revealed through price and volume. Each phase unfolds in recognizable events, the selling climax, automatic rally, secondary test, and the spring in accumulation, with mirror events in distribution. Accumulation precedes markup (an uptrend); distribution precedes markdown (a downtrend).
What is the Wyckoff method?
The Wyckoff method is a way of reading markets based on the idea that price is moved by large, informed operators (the "composite operator") whose footprints can be read in price and volume. Richard Wyckoff, a trader and educator of the early 1900s, distilled market behavior into repeatable phases and events, arguing that if you learn to read what the big money is doing, you can position alongside it rather than against it. It predates and underpins much of today's smart-money thinking.
At its core, Wyckoff frames the market as cycling between four stages: accumulation, markup, distribution, and markdown, the same rhythm described in market cycles explained. What Wyckoff adds is a detailed map of the events within accumulation and distribution, so you can estimate where in the cycle price sits. The method is interpretive rather than mechanical, relying on reading price and volume in context, which is both its depth and its difficulty. It connects closely to smart money concepts and volume trading explained.
Wyckoff accumulation: the phases (A to E)
Wyckoff accumulation is a trading range that forms after a decline, during which large operators quietly absorb supply and build positions before driving price higher. Wyckoff mapped this range into five phases, A through E, each with named events. Reading them in sequence lets a trader follow the internal story of a range and anticipate the turn before the obvious uptrend begins.
Phase A stops the prior downtrend. It typically opens with preliminary support (PS), an early attempt at buying that briefly slows the fall, followed by the selling climax (SC), a final wave of heavy, high-volume selling that exhausts sellers. A sharp automatic rally (AR) then lifts price as selling dries up, and a secondary test (ST) returns toward the SC lows on lighter volume, confirming that selling pressure has waned. The SC low and the AR high together frame the trading range.
Phase B builds the cause. Price oscillates sideways inside the range for what can be a long stretch, with repeated secondary tests of both boundaries. This is where large operators do most of their absorbing, and declining volume on tests of the lows suggests supply is thinning. The range here builds the base from which the markup launches, much like the base of a supply and demand zone.
Phase C is the test, most often the spring: a brief dip below support to check for remaining supply before the markup. Not every accumulation has a textbook spring, but when it appears it is a defining event, covered in the next section.
Phase D shows demand taking control. Price puts in a last point of support (LPS), a higher low above the range's floor, and then a sign of strength (SOS), a decisive rally on expanding volume that carries toward or through resistance. A sequence of higher lows here signals the range is resolving upward.
Phase E is the markup itself, where price leaves the range and trends higher, the accumulation complete. The schematic below sketches how these events sit within a range.
The value of naming each event is that it gives structure to what otherwise looks like aimless sideways chop, letting a trader follow the internal positioning of a range rather than waiting passively for it to resolve.
How do you identify a Wyckoff accumulation range step by step?
The schematics are easy to admire and hard to apply, so it helps to have a fixed order of checks rather than hunting for a shape.
- Confirm there was a real decline first. Accumulation follows a downtrend. A sideways range that follows a rally is more likely distribution, or reaccumulation inside a larger uptrend.
- Find the climax bar. Look for the widest down bar in the decline, on the heaviest volume of the move, that closes well off its low. That is the selling climax, and its low is the provisional floor of the range.
- Draw the range. Support runs across the climax low and the secondary test that follows it. Resistance runs across the high of the automatic rally. Everything after that happens between those two lines.
- Read volume on the tests, not on the pushes. Each return to the range low should come on lighter volume than the last. Volume drying up on tests of support is the single most useful evidence that supply is being absorbed.
- Wait for the sequence to resolve. A dip below support that closes back inside is the spring. A higher low inside the range is the last point of support. A wide-range rally on expanding volume through resistance is the sign of strength, and the range has resolved upward.
If any of these are missing, the honest label is a range, not an accumulation. Most sideways price action is just a range, and forcing Wyckoff vocabulary onto it is the most common way traders misuse the method.
Worked example: an accumulation range read bar by bar
Picture a daily chart that has fallen from 118 to 84 over several weeks. The last leg down prints a very wide red bar into 84 on roughly triple the average volume, and it closes near 88, well off its low: the selling climax. Price then rallies hard to 96 in three sessions with no meaningful supply appearing, which is the automatic rally, and 96 becomes the top of the range.
Over the following weeks price drifts back to 87, then 85, each time on progressively lighter volume. Those are the secondary tests, and the fading volume is the story: sellers who wanted out at these prices are gone. Price then chops between 86 and 95 for a month, Phase B, doing nothing interesting and shaking out anyone trading the middle.
Then a single session breaks to 82, two points below the range floor, and closes back at 88. That is the spring. Every stop resting under 84 has been filled, and the low of that bar, 82, is now the cleanest invalidation level on the chart. Price puts in a higher low at 89, the last point of support, and then rallies through 96 on the heaviest up volume since the climax: the sign of strength. Phase E has begun. Note what did the work here: not the shape of the range, but the volume behaviour at its edges and the failure of the break below 84 to attract more selling.
What is the spring?
The spring is one of Wyckoff's most distinctive events, occurring near the end of accumulation. It is a brief dip below the trading range's support, just far enough to trigger the stop-losses of weak holders and tempt breakout sellers, immediately followed by a sharp reversal back inside the range. The spring shakes out the last sellers and traps those betting on a breakdown, clearing the way for the markup.
In modern terms, the spring is essentially a liquidity grab below the range: it sweeps the stops resting beneath support, providing liquidity for the large operators to complete their accumulation, then price snaps back. A successful spring, a quick dip and recovery on a volume signature that shows the breakdown failed, is a strong signal that accumulation is nearly done and an uptrend may follow. It also hands you an unusually clean invalidation, the low of the spring itself, so you can compare the upside to that stop distance before deciding the range is worth trading at all. The chart below illustrates a spring beneath a trading range.
The spring's logic, sweeping stops to fuel a reversal, directly connects to liquidity grab trading, and it is a striking example of how Wyckoff anticipated ideas that modern smart-money traders rediscovered decades later under different names.
Wyckoff distribution: the phases
Distribution is the mirror image of accumulation, a trading range that forms after an advance, during which large operators quietly sell their positions to an eager public before a markdown. It runs through the same A to E phases in reverse, with analogous events.
Phase A stops the prior uptrend. It opens with preliminary supply (PSY), early selling that briefly checks the rise, then the buying climax (BC), a final surge of high-volume buying that exhausts demand. An automatic reaction (AR) drops price sharply as buying dries up, and a secondary test (ST) returns toward the highs on lighter volume, confirming demand has thinned. The BC high and AR low frame the range.
Phase B builds the cause for the downside, price ranging sideways while large operators distribute their holdings into public enthusiasm. Weakening volume on pushes to new highs signals demand is fading even as price holds up.
Phase C is the test, most often the upthrust (UT) or, more emphatically, the upthrust after distribution (UTAD): price pokes above the range's resistance to trigger breakout buyers and short stops, then reverses back inside, trapping the late buyers. The upthrust is the direct counterpart to the accumulation spring.
Phase D shows supply taking control. Price puts in a last point of supply (LPSY), a lower high beneath resistance, and a sign of weakness (SOW), a decisive drop on expanding volume that breaks the range's support. Phase E is the markdown, the downtrend out of the range.
Distribution is psychologically deceptive because sentiment is most bullish exactly when the large operators are leaving, which is why tops form amid optimism. Recognizing it helps a trader step aside or prepare for the markdown before the downtrend is obvious.
Wyckoff accumulation vs distribution
Accumulation and distribution are the same process running in opposite directions. Accumulation is a range after a decline where informed money quietly buys from a discouraged public, and it precedes markup (an uptrend). Distribution is a range after an advance where that money quietly sells into an optimistic public, and it precedes markdown (a downtrend). The events mirror each other event for event: a selling climax at the bottom answers a buying climax at the top, and the accumulation spring that dips below support to grab supply answers the distribution upthrust that pokes above resistance to grab demand. The tell in both is volume read against price, and the emotional trap is inverted, fear at the lows during accumulation, greed at the highs during distribution.
| Aspect | Accumulation | Distribution |
|---|---|---|
| Forms after | A decline | An advance |
| Leads to | Markup (uptrend) | Markdown (downtrend) |
| Large operators are | Quietly buying | Quietly selling |
| Climax event | Selling climax (SC) | Buying climax (BC) |
| Phase C test | Spring (below support) | Upthrust / UTAD (above resistance) |
| Resolution signal | Sign of strength (SOS) | Sign of weakness (SOW) |
| Prevailing sentiment | Fear and pessimism | Greed and optimism |
This symmetry is why the two are usually taught together, and reading one fluently makes the other easier to spot on the chart, a pattern that also shows up in market structure trading and liquidity grab trading.
Can an AI chart reader identify Wyckoff phases from a screenshot?
Partly, and it is worth being precise about which part. Given a chart image, an AI reader can outline the range, mark the extremes, identify the widest bars and the ones that closed far off their lows, and note where a volume panel shows an obvious spike or a fade. Those are visual facts in the picture, and it can state them consistently, which is more than most traders manage on a chart they already have an opinion about.
What it cannot do is confirm the phase. A phase label depends on what came before the visible window, on whether this range is a bottom or a pause inside a larger uptrend, and on volume compared with a longer baseline than the screenshot contains. A model looking at a hundred bars cannot tell accumulation from reaccumulation, because the difference lies entirely off-screen. It will also happily produce a plausible-sounding label if you ask leading questions, which is the same hindsight bias that makes Wyckoff hard for humans. The useful pattern is to ask it what it can see, the range, the climax candidate, the volume behaviour, and to keep the phase judgement, and the higher-timeframe context, on your side of the desk. That division of labour is how the AI chart analysis workflow is meant to be used.
Is the Wyckoff method still useful?
The Wyckoff method remains genuinely useful, not as a mechanical signal generator but as a framework for reading price and volume and understanding where the market sits in its cycle. Its events, climaxes, tests, springs, and upthrusts, describe real, recurring behaviors, and its insistence on reading volume alongside price is timeless. Much of modern smart-money and supply-and-demand trading is, in effect, Wyckoff's century-old logic in newer vocabulary.
The honest limitations are that Wyckoff is interpretive and takes experience to apply. Phases and events are clearer in hindsight than in real time, the schematics are idealized while real markets are messy, and identifying a spring or an upthrust with confidence is a skill, not a checklist. Because the labels are so easy to force, a neutral outside read of the range from the chart image is a useful counterweight: it describes the range and the volume it can see without being invested in the story you already prefer. Used as a lens for context and a reminder to read volume, alongside firm risk control and confirmation, the Wyckoff method enriches a trader's reading of the chart. It ties the whole price-action cluster together, from market structure trading to accumulation and the market cycle, and the modern relabelling of the spring as a break of structure preceded by a sweep is easier to see once the Wyckoff version is familiar. Term-by-term definitions live in the trading glossary.
What endures most from Wyckoff is a way of thinking rather than a set of patterns. The core insight, that price is driven by large operators whose accumulation and distribution leave readable traces in price and volume, reframes the chart from a random walk into a contest you can partly observe. That perspective encourages patience during ranges (where the real positioning happens), skepticism of climactic moves, and attention to volume as the tell of conviction behind price. Even a trader who never formally labels a Wyckoff schematic benefits from internalizing this lens, because it aligns their reading with how informed money actually behaves, which is the same foundation beneath modern smart money concepts. No software labels these phases reliably yet, and the honest limits of each product are laid out in this comparison of what the AI trading tools actually read.
Educational only. Not financial advice. The Wyckoff method is an interpretive framework, not a guaranteed system, and its phases are clearer in hindsight. Examples use illustrative data. Always do your own research.
Frequently asked questions
- What is the Wyckoff method?
- The Wyckoff method is a framework developed by Richard Wyckoff that reads markets through phases of accumulation and distribution, driven by the actions of large operators. It uses price and volume to identify where smart money is building or unloading positions.
- What is Wyckoff accumulation?
- Accumulation is a trading range after a decline where large operators quietly buy. It unfolds in phases marked by events like the selling climax, automatic rally, secondary test, and a spring, before price marks up into an uptrend.
- What is the spring in Wyckoff?
- The spring is a Wyckoff event near the end of accumulation where price briefly dips below the trading range to trigger stops and shake out weak holders, then quickly reverses back inside. It is a key sign that accumulation is nearly complete.
- How is Wyckoff distribution different from accumulation?
- Distribution is the mirror image, a range after an advance where large operators quietly sell to the public before a markdown. Where accumulation precedes an uptrend, distribution precedes a downtrend, with analogous events in reverse.
- What are the phases of Wyckoff accumulation?
- Accumulation unfolds across five phases. Phase A stops the downtrend (PS, SC, AR, ST), Phase B builds the cause through sideways action, Phase C tests supply with the spring, Phase D shows strength (LPS, SOS), and Phase E marks price up out of the range into an uptrend.
- What is the difference between Wyckoff accumulation and distribution?
- Accumulation is a range after a decline where large operators quietly buy, and it precedes an uptrend. Distribution is the mirror after an advance where they quietly sell, and it precedes a downtrend. Accumulation ends with a spring below support, distribution with an upthrust above resistance.
- Is the Wyckoff method still useful today?
- Yes, as a framework for reading price and volume and understanding market phases, though it is interpretive rather than mechanical. Its concepts underpin much of modern smart money and supply-and-demand trading.
- How do you identify a Wyckoff accumulation pattern on a chart?
- Look for a sustained decline that stops on a high-volume selling climax, a sharp automatic rally that sets the range top, a lighter-volume secondary test of the lows, a long sideways phase, then a dip below support that snaps back. A higher low and a strong rally out of the range complete it.
- What is the selling climax in Wyckoff?
- The selling climax is the Phase A event where panic selling peaks on very heavy volume and a wide-range down bar, then price closes well off the low. It marks the point where large operators absorb the last of the panic supply and it sets the floor of the accumulation range.
- What is reaccumulation in Wyckoff?
- Reaccumulation is an accumulation range that forms partway through an existing uptrend rather than at a bottom. It looks like a pause or consolidation in which large operators absorb profit taking, and it resolves upward into a further markup instead of reversing the trend.
- What is the difference between an upthrust and a spring?
- A spring is a brief dip below the support of an accumulation range that reverses back inside, and it points to a coming markup. An upthrust is a brief poke above the resistance of a distribution range that reverses back inside, and it points to a coming markdown. They are the same trap in opposite directions.
- Is Wyckoff distribution the same as a double top?
- No. A double top is a two-peak price shape. Wyckoff distribution is a whole range with a sequence of events and a volume story: buying climax, automatic reaction, secondary test, upthrust, sign of weakness. A distribution range can contain a double top, but the shape alone is not distribution.
About this byline
Markets & product research
The Bullynx editorial team researches and reviews the trading concepts, indicators, and tools we write about. Our articles are educational and are reviewed for accuracy before publishing. They are not financial advice.
Seeing this setup on your own chart? Upload the screenshot and Lynx AI maps the structure, the levels that matter, and a long or short bias, with what would invalidate it.
Keep reading
- Best Timeframe for Day Trading ChartsChart Reading & Patterns
- Best Timeframe for Swing TradingChart Reading & Patterns
- Break of Structure in Trading: How to Spot a Valid BOSChart Reading & Patterns
- Breakout Trading Strategy: Entry, Stop and TargetChart Reading & Patterns
- Candlestick Patterns Cheat Sheet: The Key PatternsChart Reading & Patterns
- Change of Character (CHoCH): How to Identify ItChart Reading & Patterns
Educational only. Not financial advice. NFA. Bullynx is not a registered investment adviser or broker-dealer. Trading and investing involve significant risk of loss. Read the full risk disclosure or how this article was researched and reviewed.