
AI chart analysis
AI chart analysis,from a screenshot.
Upload a screenshot of any chart and get a clear read back: the trend, the support and resistance levels that matter, and both scenarios with the reasoning behind them.
Read my chart
Drop a screenshot below. It stays in your browser through account setup and onboarding, then your first read runs as a free preview.
Drop your chart screenshot, or click to choose
PNG, JPEG or WebP, up to 5MB
Create your account and personalize Lynx. Your first read is a free partial preview; a plan unlocks the full read.
Screenshot from any platform · Educational only, not financial advice
An example read
This is what comes back from your chart.
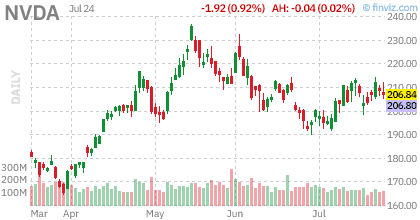
One consistent structure every time: a verdict, the levels that matter, and both scenarios with the reasoning. The sample below adapts to the market you are most likely charting.
Verdict
Entry
118.40
Target
132.00
Invalidation
112.80
Bullish continuation
Pullback to support
Sample output. Educational only. Not financial advice.
What is AI chart analysis?
AI chart analysis is reading a chart with a vision model instead of by hand. You give it a screenshot, it identifies the structure in the image, the swing highs and lows, the zones price has reacted to, the indicators drawn on the chart, and returns that as a written read with numeric levels. It describes what is on the chart. It does not predict the next candle, and it is not financial advice.
Longer background reading: the complete guide to AI chart analysis, how to analyze a chart with AI step by step, and the best AI tools for chart screenshots.
What you get from a chart screenshot
Every upload returns the same four parts in the same order, so two charts stay comparable.
- The trend read
- Which direction the chart is actually in on the timeframe you uploaded, and whether the structure is clean or choppy. A direction without that qualifier is the part most screenshot reads get wrong.
- The key levels
- The support and resistance zones price has genuinely reacted to, quoted as numbers you can put on your own chart.
- Both scenarios
- A bullish case and a bearish case, each with the condition that sets it in motion. You get the argument against your position, not only the one for it.
- The invalidation
- The level at which the read stops being true: the line that turns an opinion into a plan you can size around.
What the AI reads, and what it cannot see
A screenshot is a fixed window on one moment. Knowing the edge of that window keeps the read useful.
It reads
- Candle and bar structure, including the swing highs and lows that define the range
- Support and resistance zones price has visibly respected inside the screenshot
- Indicators that are drawn in the image, such as moving averages, RSI, MACD, or volume
- The ticker, timeframe, and price scale when they are legible in the capture
It cannot see
- Price action outside the window you cropped, so a level just off-screen is invisible to it
- Live quotes, order flow, or the order book: a screenshot is a moment, not a feed
- Earnings dates, filings, or news that would explain a move
- Your position size, account balance, or risk tolerance unless you say so in chat
Works from any platform
The read works on an image, so the platform you charted on does not matter: TradingView, MetaTrader 4 or 5, Webull, Thinkorswim, a broker app, or a screenshot a friend sent you. These pages go into the detail for each one.
- Chart screenshot analyzer
What a screenshot analyzer is, what it returns, and where it stops being reliable.
- TradingView screenshots
How to capture a TradingView chart so the levels come back as real prices.
- MT4 and MT5 charts
The same read for MetaTrader, which has no AI of its own inside the platform.
- AI trade plan generator
What a generated plan contains, and why a plan without an invalidation level is not a plan.
- AI support and resistance
How a vision model infers levels from an image, and how to sanity-check one before trusting it.
If you are still deciding whether a machine can read a chart at all, start with can AI read a chart screenshot, why AI misreads price levels on charts, and which AI chart tools give real invalidation levels. The protocol we use to test a chart reader is published in full: our AI chart reader evaluation methodology.
Bullynx, a general AI chat, and a generic screenshot analyzer
| Axis | Bullynx | General AI chat | Generic screenshot tool |
|---|---|---|---|
| Output structure | Same four-part shape every read: trend, levels, scenarios, invalidation | Free-form prose that changes shape from one prompt to the next | Usually a verdict and a couple of levels, format varies by tool |
| Numeric levels | Explicit price levels including the invalidation point | Often descriptive rather than numeric unless you prompt hard for it | Typically numeric, depth depends on the tool |
| Repeatability | Deterministic settings, so the same chart returns the same read | Re-running the same image commonly returns a different answer | Varies by tool |
| Trading context | Carries your stated profile and strategy across the conversation | No trading framework beyond what you paste into the prompt | Chart-only, no memory of how you trade |
| Risk framing | Both sides plus an invalidation level, with an educational disclaimer | Frequently one-sided and confident in tone | Often signal-shaped, with little downside case |
Bullynx ranks itself here. The two comparison columns describe categories of tool rather than any named product, so nothing is attributed to a competitor we have not verified. See the named comparison in the best AI trading tools in 2026.
Frequently asked questions
- Is AI chart analysis free on Bullynx?
- You can upload your chart and start the flow without a card. The analysis itself runs on a paid plan: Pro is $39 per month or $374 per year, Elite is $99 per month or $950 per year. There is no free allowance and no cardless access to the analysis itself.
- What is an AI chart analyzer?
- An AI chart analyzer is a tool that takes a chart image and returns a technical read of it in words and numbers: the trend, the support and resistance zones price reacted to, the indicators drawn on the chart, and the scenarios that follow. It replaces the manual work of marking a chart, not the decision about what to do next.
- How do I analyze a chart screenshot with AI?
- Crop the capture so the ticker, the timeframe and the price axis stay in frame, upload it, and read the structured response. Keeping the axis visible is what lets the levels come back as real prices instead of vague descriptions. A full-window screenshot beats a phone photo of a monitor.
- How accurate is AI chart analysis?
- It is accurate at describing what is in the image: the trend, the levels price reacted to, the indicators drawn on it. It is not a forecast. No chart read, human or machine, predicts the next candle, which is why every read gives both scenarios and an invalidation level instead of one call.
- Which markets and timeframes does it work with?
- Any market you can screenshot: stocks, ETFs, crypto, forex, futures, and commodities, on timeframes from one minute to monthly. Higher timeframes usually read cleaner because the structure is less noisy.
- Does it work with TradingView, Webull, or MetaTrader screenshots?
- Yes. It reads the image, not the platform, so captures from TradingView, Webull, MetaTrader, Thinkorswim, or a broker mobile app all work the same. Keep the axis labels and the ticker in the crop so levels come back as real prices.
- Is this financial advice?
- No. Bullynx is an educational analysis tool, not a broker, an adviser, or a signal service. It describes structure, levels, and scenarios so you can make your own decision. Trading involves a significant risk of loss.
- Does it handle stocks, crypto, and forex differently?
- The technical read is the same discipline across all three. The context differs: crypto trades around the clock, forex sessions shape intraday ranges, and stocks carry earnings and market-hours gaps. Name your market and the read accounts for it.
- What image formats can I upload?
- Standard screenshot formats: PNG, JPG, and WebP. A clean full-window capture beats a phone photo of a monitor, and light compression keeps the wicks readable.
- Can AI replace a trader?
- No. It compresses the mechanical part of chart review, reading structure and marking levels, from minutes into seconds. Position sizing, entry timing, and knowing when to sit out stay with you.
· Educational only. Not financial advice.
You have a chart open.Let it talk.
Drop your screenshot, create your account, pick a plan. Lynx runs the read the moment you’re in. Cancel anytime.
Upload my chartchart first · Stripe checkout before analysis
Educational only. Not financial advice. Read the risk disclosure.